2015年8月28日 星期五

A way to determine a CIT by Mr. James Hyerczyk

this is an extracted graph from Mr. James A Hyerczyk's book about swing trading method, which shows one of the ways in determining a change in trend.

For me, the move from 285-228 was obvious that there would be a possible CIT. However, in the perspective of swing trading, it hasn't confirmed a CIT yet. When the market reached as low as 208, it fits into the pattern defined and we should expect a retracement to a higher level before the market resume its main trend down. My guess of pattern on July 8th based on wave theory is compliant to this swing set-up, too.

http://koei1024.blogspot.hk/2015/07/hsi-possible-support-20150708.html

2015年8月23日 星期日

Expecting an end of wave B

I am not surprised with some wrong expectations or entries since these are part of the trading game. What really surprises to me is the target & pattern I guessed on July 8th... Sometimes instinct is more accurate than logical thinking... Moreover, I still insist a corrective wave undergoing based on my assumption.

After the two scenarios of a retracement between 228-256 and a double bottom have been rejected, now the only possible one left is an expanded flat wave with wave B at an extension of wave A (228-256).

Actually, there are two possible targets for this turn, since they are really close (just about 1% apart), I personally prefer 216 than 213 due to a higher chance of occurrence of .764 from my observation.


2015年8月22日 星期六

A possible confluence level for US

conditionally, this confluence level should provide a certain of support.

If it holds, I would expect a trading opportunity using Gartley pattern provided that 184-164 is AB move.

2015年8月19日 星期三

2015年8月16日 星期日

hsi 2015 vs 2007 vs 1997


people always say: history repeats itself... but HOW?

some believes in Elliot wave theory that any market can be classified into impulse waves and corrective waves which make a market look alike in many different time-frame (that's self-similarity behaviour of fractals) It's like how leaves, branches are grown on trees.

One's belief system influences his/her behaviour. Thus, building up a "reliable" and "beneficial" system is crucial to anyone who wants to participate in this survival game.

In trading world, there are too many aspects/skills/methodology of technical analysis to name. A very important objective is we are here to earn a living as a basic requirement, and for those who are more skillful/gifted, they can even earn a fortune by trading (or investing). For me, investing is just part of the game of trading, that we bet on probability a public list company/index future/currency could move in favour of us, no matter it is by analysing financial report, GDP forecast, import&export data, or OHLC price data at a longer time-frame.

Above chart is a comparison of the wave forms of hsi in different periods. A point in common is that there is a sharp fall followed by a side-way development. Certainly, this is only for educational purpose, not a trading advice.

In the mini-chart on the left, since the correction wave was an expanded flat where B exceeded the start of A and C exceeded the start B. This was my initial assumption when the market reach 228-239 level.

My guess now is there will be a top near 266 regardless of which type of the corrective wave will form

"Nothing just happens, everything is planned" in the view of the trading index/stock/commodity, there are usually something left for us to trace.

2015年8月10日 星期一

A guess of coming pattern (revised Aug. 10, 15)

http://koei1024.blogspot.hk/2015/07/a-guess-of-coming-pattern-rev-jul-20.html

with the given time frame (early/mid Aug.), market has completed a 50% retracement.
a situation of bullish but rather side-way could happen until mid/end Sep.

2015年7月31日 星期五

2015年7月30日 星期四

2015年7月27日 星期一

island top

 In some cases, people can still able to find an escape door & settle their position within the range of an island top (23rd of DAX); but in highly volatile, it is rather urgent to cut the loss fast enough (23rd of Nikkei 225) without given a 2nd chance/thought to remedy one's position.

Although there is no such topping pattern in hsi, after it has broken 248-249 level, the trend become bearish again ... move from 228 to 256 could be regarded as one of the counter-moves against the main down trend.


2015年7月21日 星期二

Dax td 20150721

it seems Jul. 21-23rd to be a suitable time window for DAX...

Interesting point is:
A/B=B/C (off about 0.3%)

11802 is about the .618 retracement level of the previous wave...

2015年7月20日 星期一

專注

http://tmblr.co/ZXRpYqu6Tdat
http://www.forexjournal.com/interviews/599-an-interview-with-larry-pesavento

除左 trading world (see above links of the interview with Mr. Larry Pesavento), 其實好多學問/學術都係靠不斷浸淫和鑽研, 做到日思夜想, 先至出到成積. 即係由個人發展出靈感/insight/edge, 係其他人無或者極少數人.

唔夠專注, 就注定失敗.

<<貨幣戰爭>>作者宋鴻兵先生, 我覺得佢係位既讀懂歷史, 亦解通經濟在戰爭和國家博弈背後的原因. 德國二戰時打蘇俄(莫斯科, 油田), 日本打美國(珍珠港, 中途島)及東南亞, 以前我覺得奇怪...


A guess of coming pattern (rev. Jul. 20, 2015)


on Jul. 8th, market reached as low as 228 instead of 237-239 as I thought.

The rebound is about the same level as previous bottom 256. Thus, "an old bottom becomes a resistance". Furthermore, it also matches with the time window, Jul. 15-16.

Now the question is: will this move end with a retracement between 228 & 255? or a double bottom ~ 228? or a lower leg at 216?

If the pattern is valid, after a down move has formed, we should expect a vigorous surge to 50% or 61.8% of the previous wave (285-228), that is 256 or 263. Personally, I prefer the latter one just for a nicer (visually) symmetric pattern.

Time window of the down move could be early or mid Aug., end Sep. should be reserved for a big change/turn, like an end of correction wave.

http://koei1024.blogspot.hk/2015/07/hsi-possible-support-20150708.html

2015年7月18日 星期六

Supply and demand in real life and trading

In our daily lives, when a commodity like iPhone 6+ is getting hot, that means there is a growing popularity, more and more people are buying;


In contrast, when something is losing its popularity (e.g. cheese cake, crazy fries, Taiwanese pearl milk tea/bubble tea... ), fewer and fewer people are buying.

In trading world, we have similar situation that a trend is supported with higher ''popularity'' ie. volume but a trend is not valid when the volume is shrinking (as well as no direction in some consolidation pattern). This could explain the current situation we have in hsi:

my questions are: does this 'uptrend' starting from July. 8th supported with higher and higher/lower & lower 'popularity'? does it behave like the uptrend in March-April this year (left of below chart)?

before applying very sophisticated model/calculation of trading, taking a look in a layman's eye may be interesting.


2015年7月14日 星期二

US30 20150714


Below calculation requires some knowledge of wave theory and some high school math...

assume a ABC expanded flat is complete,

range of A=247;
range of B=357;
range of C=524 where
1.4453*A=B;
1.4678*B=C;
2.1215*A=C

take sq. root of 2.1215, we get 1.45654;
mean/average of 1.4453 & 1.4678 is 1.45655.

So, GM=AM but they rarely matches...


of course, most importantly, the rebound has reached 50% of the previous wave (not range)


Nikkei 225(Daily)20150714

trend line was once broken and now is very likely under re-test

2015年7月13日 星期一

time window - checked


http://koei1024.blogspot.hk/2015/06/hsce-td-2015060.html

I have expected a sharp fall before July 15-16th comes, and I now believe 15-16th could be a minor top that we should pay attention to.

In my point of view, market may become choppy for a while before a clear direction would be presented to us...

July 21-23rd is another time window to look at...

Next major time window will be end Sep. to early Oct.

2015年7月10日 星期五

2015年7月9日 星期四

2015年7月8日 星期三

hsi possible support 20150708


Today, it has reached as low as 23700 which is right on the support trend line, and about the fibo. ratio of a bigger range 161-285. I believe it can provide a concrete support to hold for some days since the line was respected over some years.

However, if it fails one day, it should seek support near 223 or even 209 as shown in my previous post.

My guess:
新增說明文字

2015年7月5日 星期日

hsi wk 20150705


http://koei1024.blogspot.hk/2015/05/my-way-to-look-at-this-need-to-re.html

Bullish view:

a1- a "healthy" correction as most people 'hope'.
'Rationally', 249 or 239 should mark the end of this down swing comparing the green & red lines & fibo. retracement. More importantly, thicker blue trend line holds

a2- if I were bullish, I would expect a target near circle 7, utmost circle 5, before another "bullish" major trend would have come ...

'less' bullish or bearish view:
"break & re-test of trend line" scenario:

b1- after 239 level has broken and thus the thicker blue trend line, a stronger support should be between 223-229, and would follow with a strong sharp reversal to 248-255 level. finally, it would end the correction near 223-229 level for double bottom pattern or a lower leg for C wave of ABC zigzag correction

b2- (with ref. to cruel oil from Jun. 2014 to Jan. 2015) retest of trend-line as in b1) would lead to a drastic meltdown to level near 161 but the end would be yet to come ...

(this post is not meant for any trading advice...)

起(終)點


做人做Trade都一樣, 離開起點越遠, 越容易忘記起初的願望/想法/熱情, 被沿途景色人物off-track. 


http://koei1024.tumblr.com/post/60240833402

2015年7月1日 星期三

US 30(15 Minutes)20150701

ABC correction:
1.66xA=C

DAX td 20150701

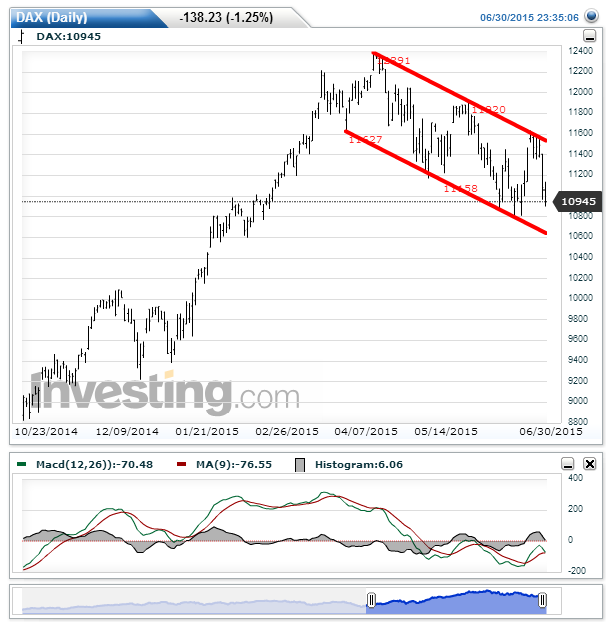
within a channel... the only thing is to wait for a break-out...

Otherwise, follow swing trading method for a set-up (bearish when 10800 is broken or bullish when 11600 is broken)

US 30 wk 20150701

a trend line plus a retest, and then a break-away gap... what's more?

MACD divergence over 3 successive tops... come on! can there be the 4th top ...... ?