
2019年1月22日 星期二

2018年10月22日 星期一

2016年4月5日 星期二
883 td 20160405 (break-away gap)
a ref. of break-away gap from an online source (http://www.tradingday.com/c/tatuto/thegapprimer.html) :
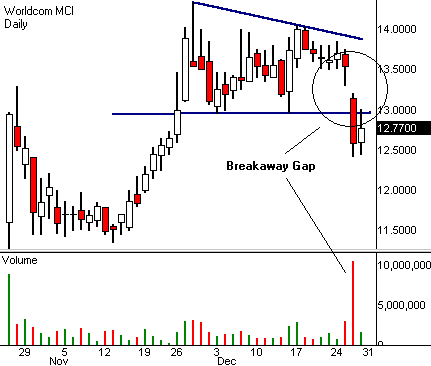

What's happening here:
- a break-away gap after a break-thru of consolidation area (contracting triangle/wedge, whatever)
- last time the stock showed the same combo of break-thru+break away gap was in Aug-Sep. 2014. This marked a beginning of the downtrend, see if it will do the same this time
2016年4月1日 星期五

2015年11月20日 星期五
883 - possible long term bottom coming

After 883 has failed to climb higher, I hold a different view of it from hsi and my bearish target is about 5.3-5.5 in 2016 Q1/Q2
2015年11月14日 星期六
A change to short-term bullish view
next week if hsi weekly bar is a down bar, I would change to become bearish since Oct 26th could be a significant turning date. When time squares price (td closing price below 0.333 and time 0.333 between top&bot), many people would think it is valid now.
I would set myself a stop order at 220 for hsi since a re-test is more likely; similarly, 883 will find its ground to land instead of 11.66... Certainly, if that happens, this could be an once-in-a-life opportunity to buy like a big sale.
http://koei1024.blogspot.hk/2015/11/hsi-20151112.html
http://koei1024.blogspot.hk/2015/11/883-td-20151104.html

The down move from Oct. 26th would end around early Jan. reaching a level as low as 205-208, which would follow with a rebound for just a few weeks into March 2016 and then a termination fall. Some people think 15k in Q2 or Q3 of 2016 but who can actually know...
DJI has reached .886 or 18000 level and react/fall decisively, this retracement has ended...
http://koei1024.blogspot.hk/2015/11/dji-short-and-long-term-views-follow-up.html
2015年11月4日 星期三
883 td 20151104

.333 - .382 level is not supportive this time, it eventually reached a level near .500 twice (short term double bot) on daily chart and follows with today's break-away & wide range bar. I would expect an extension (>1.00) of this CD move, target 11.66
2015年10月14日 星期三
883 td 20151014

low of today is 8.90 which is almost the .333 level of retracement between 9.60 & 7.41. If it is valid, it may reach a 100%-161.8% extension of the range of 9.60 & 7.41, that is 11.07/11.67/12.42. Personally, I think 11.67 is more likely than the others (see also http://koei1024.blogspot.hk/2015/10/883-monthly-weely-review.html).

2015年10月11日 星期日
883 monthly & weely review

883.hk/CNOOC was one of the stocks+indexes that I traded since 2007, the time I jumped into the market without adequate knowledge, and is still trading & monitoring. One of the reasons I am still trading it is that I earned for some times of sweat sums of money by trading its derivatives in 2008, and fewer occurrence than other stocks in having a loss upto this moment.
Obviously, this is undergoing a downward channel for years, and I was lucky enough in catching some tops & bottoms. And now, a critical moment has come - a potential bottom reaching the channel lower boundary, plus testing a nice retracement level, .786.
Its main trend is going down (downward channel) since there are lower-top-lower-bottomg according to its 3-bar monthly chart, many of the swing bottoms have already been broken. Although it is TOO far, there is a possible support at 3.83... (6 dollars lower from 9.27 or -64.7%...) obviously not a useful reference... 0.886 could be a higher support but still not much of practical use ...

By measuring each up & down moves, there are some noticeable tendency since 2011:
For down move, weeks taken are either 15-17 or 25-26; size is from 5.02-6.16 (10.20 excluded for a channel scenario)
For up move, weeks taken are either 19-22 (12 & 30 excluded); size is from 4.06-4.46 (7.08 excluded)
If the end of Oct. 2nd 2015 is a low and we try to project the coming up move from this point, I would expect a swing size of about 4 (I put 4.46 on the 2nd chart) and last for about 20 weeks. the projected price target is close to .618-.667 level between 13.70-7.41 which add to the meaningfulness of this projection.
Before that happen, a minor swing top at about 10.16 could be an important resistance, in order to identify change in a minor trend.

If the rebound is failed, it could land around 5.82-6.0 (.886 retracement level and a swing bottom) or even lower.
2015年6月25日 星期四
883 td 20150625

in extreme case, (main trend down in red box) there may be a moderate correction before the last leg has gone down...provided 10-20% is ''moderate'' enough here...
http://koei1024.blogspot.hk/2015/05/883-td-20150520.html
2015年5月20日 星期三

2014年12月10日 星期三
883 bottom projection 20141210

Price below 10 will be VERY attractive if we look back 1-2 years later

2014年11月22日 星期六
883 20141121


2014年11月7日 星期五
883 monthly 20141107

2014年9月12日 星期五
883 & 939 wk 20140911

(level of top adjusted)

2014年8月21日 星期四

2014年6月25日 星期三
883, 939 20140625


a recent high reached 0.618, good gain-loss ratio for entry, target 13.1->12.5
Remarks: range for fibo. needs not to be the previous whole swing, more important is different level of fibo. are respected by its internal structure, e.g. top or bottom rest on fibo ratio., it respected once, it will respect one more; twice, two more, etc.
________________________________________________________________________


939 nearly touches the downtrend of weekly closing prices, its internal structure quite respects fibo.
very bearish should see a double bottom around 4.7-4.9, at the moment just for around 5.25-5.27
a closer look of fibo being respected.
(I hid the green diagonal on purpose...)
2014年6月19日 星期四
883 td 20140619

I wrongly guess it will reach bottom before reaching this high level... anyway
(upper trend line amened)
2014年6月8日 星期日
883 20140606


2014年5月31日 星期六

訂閱:
文章 (Atom)