顯示具有 hsi 標籤的文章。 顯示所有文章

2020年10月22日 星期四

2017年9月27日 星期三

hsi td 20170927

2nd time, same pattern formed near the moving average in this year.

2017年5月10日 星期三

2017年5月2日 星期二

hsi - gaps


This is how I find gaps, happen intraday or market open, are interesting.

2017年4月26日 星期三

2017年4月25日 星期二

short-term possibly changes to uptrend


for short-term, positive reversals in both RSI and MACD.


same here for short-term, positive reversals in both RSI and MACD, volume was shrinking during the consolidating wedge which is normal. We need a break-out to the north with extra high volume to confirm the wedge.


2017年3月6日 星期一

hsi 20170306 - buying low

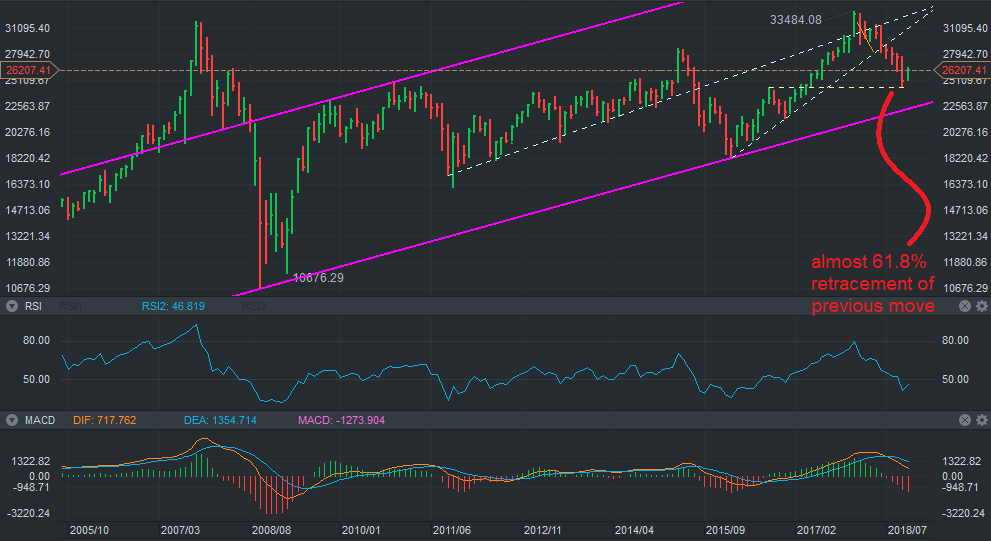
Everyone in the markets knows that buying low and selling high are the key to make the most profit from the market. However, where/when is low or high enough? No standard answer. Some says when there is a blood-shed for a low to happen, a change in major trend, historical cycle low/high, etc.

One of my favourites is RSI 14-period that historical movements are ranged within 0 to 100. Certainly, it doesn't mean a high with RSI 100 moving to a low with RSI 0, which all depends the trends.

We can just try to buy at a "relative low" and/or sell at a "relative high" level, which is profitable enough in a trade. This is what we aim for and consider to bear some risk in the market. We are not scientists nor mathematicians who chase for ideal case or perfection.

If we look at RSI on a monthly chart, it reveals a way for most people who are patient enough to wait for a relative low to buy. However, to predict a high to sell, I am not confident to mark a specific range as it really depends whether the market is in a bearish or bullish cycle.


2017年3月2日 星期四

hsi 20170302

http://koei1024.blogspot.hk/2017/02/hsi-td-20170221.html
- 3 signals observed
- in addition, a re-test at the white trend line


Furthermore, from its weekly chart:
- a potential double top (two red arrows)
- a potential evening star (white circle)


2017年2月21日 星期二

hsi td 20170221


a few signals to look for a reversal: 1/ breaking of supporting uptrend line on price chart 2/ fall below the bottom line of this bullish trend on RSI chart. 3/ MACD bearish cross?

2017年2月20日 星期一

hsi 20170220

in end December 2016, I expected for a rebound to 22500 level. (http://koei1024.blogspot.hk/2016/12/hsi-hr-20161229.html). But it was far too early for a top to appear, it evolved into a consolidation around that level (mid Jan., 23000-22600).

As a trader, I admit I can make mistake. Never fatal since my entry is relatively small. Most importantly, in order to survive in the market, we need to stay sharp with changes that are against our expectation and shall cut loss fast.

For the moment, there is no obvious signal showing any weakness in market. One should note the decreasing volume since Feb. 15th would indicate a top is forming or not.


2017年2月3日 星期五

2017年1月26日 星期四

hsi hr 20170126


on Jan. 23rd, the reversal hasn't begun since the support was held (red line).

Now the market may have developed into a 3-drive pattern that every up moves appear almost symmetrical in price and time. MACD also signals two  divergences of the 3 consecutive tops which could indicate the market is running out of steam...


2017年1月16日 星期一

hsi 20170116


1) breaking of uptrend, pay attention to a reversal or a consolidation to follow


2) after tested the RSI bearish upper limit, we can try to have a clear position preparing for a down move