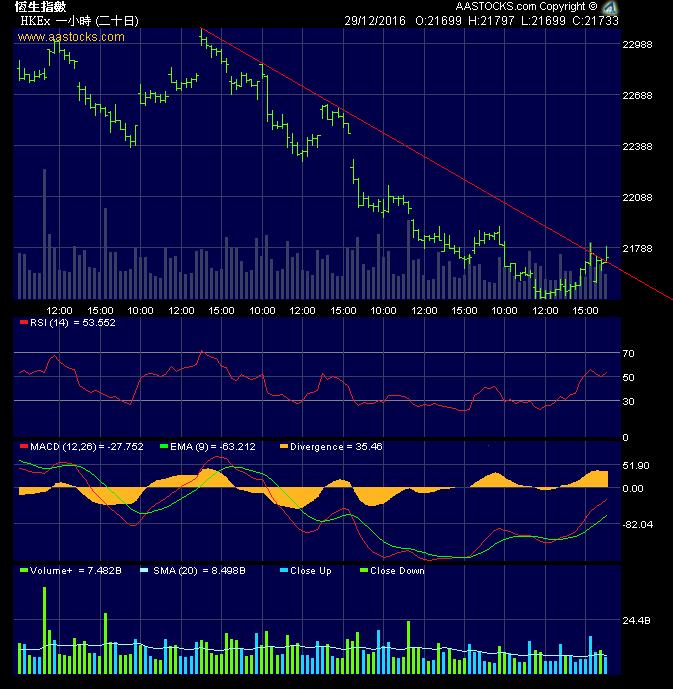
強勢股向上突破常有的成交配合
2017年7月19日 星期三
2017年6月19日 星期一
2017年6月7日 星期三
2017年5月12日 星期五
2017年5月10日 星期三
hsi gaps 20170510
http://koei1024.blogspot.hk/2017/05/hsi-gaps.html
事後孔明? keep the trend line extrapolated, sometimes it works as support/resistance
Gold & silver, intermediate & short term, double signals
an important support level (white circle)
premature signal(positive reversal)+a downtrend line
also true in short-term, premature signal (bullish divergence) +a downtrend line
trendline not drawn well ...
2017年5月2日 星期二
2017年4月26日 星期三
2017年4月25日 星期二
short-term possibly changes to uptrend
for short-term, positive reversals in both RSI and MACD.
same here for short-term, positive reversals in both RSI and MACD, volume was shrinking during the consolidating wedge which is normal. We need a break-out to the north with extra high volume to confirm the wedge.
2017年3月22日 星期三
2017年3月6日 星期一
hsi 20170306 - buying low
Everyone in the markets knows that buying low and selling high are the key to make the most profit from the market. However, where/when is low or high enough? No standard answer. Some says when there is a blood-shed for a low to happen, a change in major trend, historical cycle low/high, etc.
One of my favourites is RSI 14-period that historical movements are ranged within 0 to 100. Certainly, it doesn't mean a high with RSI 100 moving to a low with RSI 0, which all depends the trends.
We can just try to buy at a "relative low" and/or sell at a "relative high" level, which is profitable enough in a trade. This is what we aim for and consider to bear some risk in the market. We are not scientists nor mathematicians who chase for ideal case or perfection.
If we look at RSI on a monthly chart, it reveals a way for most people who are patient enough to wait for a relative low to buy. However, to predict a high to sell, I am not confident to mark a specific range as it really depends whether the market is in a bearish or bullish cycle.
One of my favourites is RSI 14-period that historical movements are ranged within 0 to 100. Certainly, it doesn't mean a high with RSI 100 moving to a low with RSI 0, which all depends the trends.
We can just try to buy at a "relative low" and/or sell at a "relative high" level, which is profitable enough in a trade. This is what we aim for and consider to bear some risk in the market. We are not scientists nor mathematicians who chase for ideal case or perfection.
If we look at RSI on a monthly chart, it reveals a way for most people who are patient enough to wait for a relative low to buy. However, to predict a high to sell, I am not confident to mark a specific range as it really depends whether the market is in a bearish or bullish cycle.
2017年3月2日 星期四
hsi 20170302
http://koei1024.blogspot.hk/2017/02/hsi-td-20170221.html
- 3 signals observed
- in addition, a re-test at the white trend line
Furthermore, from its weekly chart:
- a potential double top (two red arrows)
- a potential evening star (white circle)
- 3 signals observed
- in addition, a re-test at the white trend line
Furthermore, from its weekly chart:
- a potential double top (two red arrows)
- a potential evening star (white circle)
2017年2月21日 星期二
hsi td 20170221
a few signals to look for a reversal: 1/ breaking of supporting uptrend line on price chart 2/ fall below the bottom line of this bullish trend on RSI chart. 3/ MACD bearish cross?
2017年2月20日 星期一
hsi 20170220
in end December 2016, I expected for a rebound to 22500 level. (http://koei1024.blogspot.hk/2016/12/hsi-hr-20161229.html). But it was far too early for a top to appear, it evolved into a consolidation around that level (mid Jan., 23000-22600).
As a trader, I admit I can make mistake. Never fatal since my entry is relatively small. Most importantly, in order to survive in the market, we need to stay sharp with changes that are against our expectation and shall cut loss fast.
For the moment, there is no obvious signal showing any weakness in market. One should note the decreasing volume since Feb. 15th would indicate a top is forming or not.
As a trader, I admit I can make mistake. Never fatal since my entry is relatively small. Most importantly, in order to survive in the market, we need to stay sharp with changes that are against our expectation and shall cut loss fast.
For the moment, there is no obvious signal showing any weakness in market. One should note the decreasing volume since Feb. 15th would indicate a top is forming or not.
2017年2月3日 星期五
hsi hr 20170203
http://koei1024.blogspot.hk/2017/01/hsi-hr-20170126.html
it has broken lower boundary of the channel, let's expect sth to go down for some moments
2017年1月26日 星期四
hsi hr 20170126
on Jan. 23rd, the reversal hasn't begun since the support was held (red line).
Now the market may have developed into a 3-drive pattern that every up moves appear almost symmetrical in price and time. MACD also signals two divergences of the 3 consecutive tops which could indicate the market is running out of steam...
2017年1月16日 星期一
hsi 20170116
1) breaking of uptrend, pay attention to a reversal or a consolidation to follow
2) after tested the RSI bearish upper limit, we can try to have a clear position preparing for a down move
2017年1月6日 星期五
hsi hr 20170106
From previous post (http://koei1024.blogspot.hk/2016/12/hsi-hr-20161229.html), a negative reversal was expected. Now, there is a clue for a potential negative reversal showing weakness at 225-226xx level which is a confluence target at different ranges. It is interesting to watch out for a change at this level.
2016年12月29日 星期四
2016年12月21日 星期三
2016年12月19日 星期一
SP500 (CFD) diamond top
diamond top isn't a common pattern. When it is confirmed, the force of reversal could be very strong...
2016年12月15日 星期四
2016年12月13日 星期二
2016年12月12日 星期一
2016年11月24日 星期四
2016年11月17日 星期四
hsi - trade with the bigger trend
we always talk about the main trend, it merely depends on what timeframe we are trading. If someone is trading for a few hours/days, just follow the trend in the weekly/monthly chart which would give us a higher probability to be correct with a higher downward momentum in downtrend, vice versa.
2016年11月16日 星期三
當人口老化遇上拒當樓奴潮
人口老化, 手上有資產會賣出以過日, 樓宇供應增加, equlibrium price 下跌;
年青一代拒當樓奴, 樓宇需求下降, Qp 下跌.
https://hk.news.yahoo.com/%E9%9D%92%E5%B9%B4%E6%8B%92%E7%95%B6%E6%A8%93%E5%A5%B4-%E5%83%8527-%E6%93%AC%E7%BD%AE%E6%A5%AD-225519867.html
香港政府土地供應由近二十年嘅低位拉扯向上, 樓宇供應增加, Qp 下跌...
http://www.info.gov.hk/gia/general/201611/16/P2016111600443.htm
黎緊30年, 投資私人住宅市場, 係長升長有, 定長跌長有, 定係橫行呢?
年青一代拒當樓奴, 樓宇需求下降, Qp 下跌.
https://hk.news.yahoo.com/%E9%9D%92%E5%B9%B4%E6%8B%92%E7%95%B6%E6%A8%93%E5%A5%B4-%E5%83%8527-%E6%93%AC%E7%BD%AE%E6%A5%AD-225519867.html
香港政府土地供應由近二十年嘅低位拉扯向上, 樓宇供應增加, Qp 下跌...
黎緊30年, 投資私人住宅市場, 係長升長有, 定長跌長有, 定係橫行呢?
2016年11月14日 星期一
learning from the past: HSI vs DJI
For easier comparison, the two charts are in semi-log and both start with a major historical low (DJI: the great depression; HSI: during 1973-74, the index dropped 91.54%...). In my point of view, it is a kind of consolidation/sideways in a large scale before the next dominant up trend comes.
I generally believe a bottom near 161 or 106 in order to reversing the trend from de-leveraging process.
hsi-wk-zic-zac-abc-correction - follow-up
http://koei1024.blogspot.hk/2016/08/hsi-wk-zic-zac-abc-correction.html
a typical waveform in a long term down trend, we are either near the turning point of a B wave of ABC correction or II wave of I-II-III-IV-V wave. Considering the macroscopic view of a consolidation pattern from 1996 until (roughly) 2020, personally a ABC correction is more preferred.
2016年8月31日 星期三
訂閱:
文章 (Atom)