
2015年12月30日 星期三
hsi review 20151230

(Dec. 30th is an outside bar with a lower price close)
1/ Swing analysis, 3-bar daily:
- trend
starting from end Oct. 23424, it is showing a down trend with "lower-top-lower-bottom"
condition that market can rebound but not exceed a previous top until a reversal takes
place.
- Price
swing sizes are 1465 and 1792 for down swings; 844 & 1207 for up swings. If 22217 is
confirmed as a swing top, I will expect a swing bottom from 20425 to 20752, roughly
higher than a swing bottom with price low 20368.
- Time
duration of down swings are both 21 trading days and 7-8 t.d. for up swings. I would
expect near or at Jan. 25th for a potential swing bottom

2/ Fibonacci
this turn seems to end with a top at 22217, which is 0.50 between 23424 & 21010 and
close to 0.666 between 22803 & 21010

3/ Geometry
- trendline, day high
although Dec. 24, 28 and 30th have moved above the line, only Dec. 24th can close
above it and then fall back
- trendline, closing price
on the third chart, only Dec. 24th has closed above the line for one day
(simply a false break)
- 1x1
it is broken the one plotted from 21010, and the line is well re-tested on Dec. 30th.
4/ Indicators
hourly MACD has shown a weakening tendency since Dec. 24th and a potential
reversal may have occurred.
5/ percentage stop
for sharp rebounds, I would use 1% trailing stop as to monitor potential turning points
2015年12月29日 星期二

2015年12月28日 星期一
ig hs50 20151228

how do we apply the rule of "fourth time at a same level" introduced by Mr. W.D. Gann? One of the online source (http://www.solarmatrix.com/wdgann/lessons/LESSON1.htm) shows:
Rule 4: Fourth time at the same level.
Fourth time through a level of support or resistance is powerful and one should go with the direction of the professionals.
When a "level" is diagonal (instead of horizontal), I believe the same rule can be applied. Therefore, if the diagonal line has been respected as a support for three times, it will be important to watch for and follow the direction when it is broken. This is a collective result of the action by professionals.
2015年12月25日 星期五

2015年12月22日 星期二

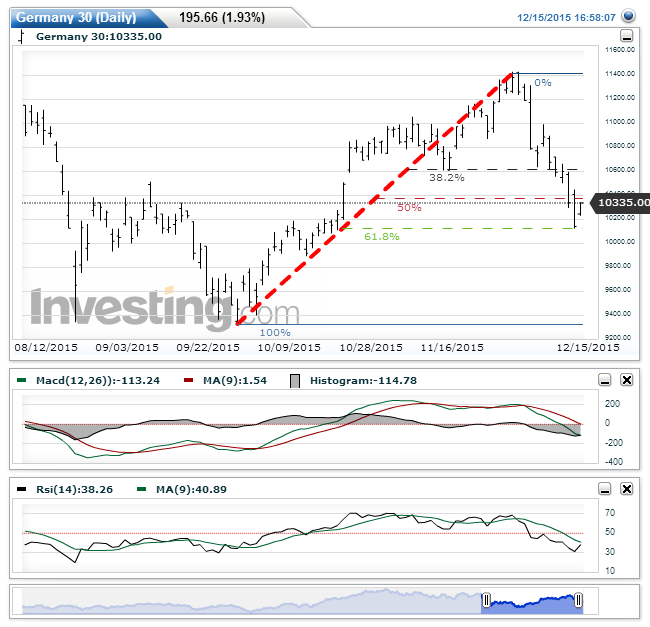
2015年12月15日 星期二
加息令資金流入還是流出?
好多人估美國會聽日加息, 會引發環球資金班師回美, 令到美元會進一步升值. 投資O既野好多時都係未來O既事discount到今日發生, 除非突發事件, 好少話去到發生O個日先出現影響.
加息無錯係會令到存款利息略為增加, 令到資金流入, 但這只是事實O既其中一面; 加息同樣會令投資者考慮減少新造借貸, 即係整體貸款規模下跌 (還完錢唔再借或借少O的), 唔好睇少呢種貸款規模下跌O既影響, 因為"吹"出來O既泡沬無增加甚至縮細, 資產價格係可以跌得好快, 因為人人都比銀行或財仔 call 緊 loan (e.g. mortgage, stock/saving backed loan). 再復雜D, 世界上有咁多低息甚至負息貨幣可以借 (歐/日元), 美金借貸成本上升仲會唔會吸引到人走去借美元炒上炒落甚至投資?
就好似chemical bonding, attraction & repulsion 係同時存在, 只係睇下邊種力大D就決定電子電核分子之間個距離; 加息個情況都有D似, 一體兩/多面.

最近O既垃圾債爆煲, 投資者提早沽水走人, 即係資金流出緊呢個市. 會唔會引發骨牌效應令到其他美元資產出現資金流走? 世上咁多野都咁復雜, 有邊個真係可以斷定加息係會令資金流入美元/美國, 定係資金流走呢?
Technically, 美金個一百幾廿年O既趨勢係跌 (貶值), 間唔中會升番一年半載. 用美元兌黃金O個口價就一清二楚鳥;
1971年之前, 35蚊美金可以換到 1 OZ 黃金; 2015年今時今日要 1061美金. 即係黃金升左差唔多30倍, 又或者可以話45年來美金跌到得番3.29%
More recently, monthly/weekly圖會容易睇到雙頂加MACD背馳, 都係需要留意係咪已經見頂.


2015年12月14日 星期一
USD index 20151214

- a possible double top scenario
- weekly MACD divergence
- bearish if it breaks 95-96 level, a trend line from Sep & Oct 2015
hsi td 20151214

I was hesitated in reacting to this down move, what is left for coming weeks would be a important top for placing a put. Hope I could seize this chance.
2015年12月10日 星期四
hsi 20151210


2015年12月8日 星期二

2015年12月4日 星期五
偷桃


2015年12月2日 星期三

2015年11月30日 星期一
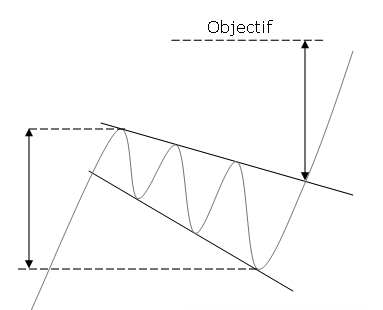
hsi possible triangle

upper chart (OHLC): red lines form a triangle using unconventional trendlines; white lines are more conventional
lower chart (closing price chart): a closing price in mid Sept. were respected twice in November, its importance should be under-estimated ...
2015年11月20日 星期五
hsi 20151120 @ market close
http://koei1024.blogspot.hk/2015/11/hsi-td-20151119.html

when the ending bell rings, the market:
1) though not achieved, if next week is also a up bar, 219 could be a swing bottom
2) applying from the observation seems work, wait for Nov. 25th to see if any possible turning signal
3) it has broken the trendlines, look for more rooms in the north if it is a valid break-out
883 - possible long term bottom coming

After 883 has failed to climb higher, I hold a different view of it from hsi and my bearish target is about 5.3-5.5 in 2016 Q1/Q2
2015年11月19日 星期四

hsi td 20151119

My idea now:
1) swing trading perspective:
weekly, to avoid a 3 conservative down bar, it is better to have an outside bar this week to signal a possible change in direction. So, today and Friday are important to watch for whether the market can seek more rooms in the north exceeding 22981. Otherwise, watch for more downward pressure if weekly closes below 22396 or 22319.
2) bar pattern:
Since end Sep. 15, we have 5 island bottom bars and every of them is followed with a gap-up. there were 3 times that market found a top in 2 days after the island bottom; one time found a top in 7 days. Compare to the current move, it is now 3 days from the isolated bot. Could we expect that it be similar to the one in end Sep.?
3) geometry(trendline):
with breaking the trendline, it could signal a possible change in direction, otherwise, continue with down move
USD/ CNY 20151119

see how a top fits 0.382 and two tops to 0.500. If it holds, could be more room to the south
2015年11月14日 星期六
A change to short-term bullish view
next week if hsi weekly bar is a down bar, I would change to become bearish since Oct 26th could be a significant turning date. When time squares price (td closing price below 0.333 and time 0.333 between top&bot), many people would think it is valid now.
I would set myself a stop order at 220 for hsi since a re-test is more likely; similarly, 883 will find its ground to land instead of 11.66... Certainly, if that happens, this could be an once-in-a-life opportunity to buy like a big sale.
http://koei1024.blogspot.hk/2015/11/hsi-20151112.html
http://koei1024.blogspot.hk/2015/11/883-td-20151104.html

The down move from Oct. 26th would end around early Jan. reaching a level as low as 205-208, which would follow with a rebound for just a few weeks into March 2016 and then a termination fall. Some people think 15k in Q2 or Q3 of 2016 but who can actually know...
DJI has reached .886 or 18000 level and react/fall decisively, this retracement has ended...
http://koei1024.blogspot.hk/2015/11/dji-short-and-long-term-views-follow-up.html
2015年11月12日 星期四
hsi 20151112

hourly: short-term reversal

2 scenarios:
A: correction with support from previous swing top in Sep., white horizontal line
B: re-test of white trendline
Which is correct? let the time tells... personally, I prefer A

Since from weekly chart, it is still within the range of previous weekly bar... just wait for a break-up of the range between 223-234
2015年11月4日 星期三
883 td 20151104

.333 - .382 level is not supportive this time, it eventually reached a level near .500 twice (short term double bot) on daily chart and follows with today's break-away & wide range bar. I would expect an extension (>1.00) of this CD move, target 11.66
2015年11月3日 星期二
dji short and long term views - follow-up
http://koei1024.blogspot.hk/2015/10/dji-short-and-long-term-views.html

Swing bottoms 17038, 17466 were broken after the previous post; fibo .764 isn't provide much resistance at all. Now it could be 18000 or .886 to provide a certain resistance.
My guess is, the market strength could even bring us to 18351 or slightly higher (1.618 extension shown on monthly chart).


Swing bottoms 17038, 17466 were broken after the previous post; fibo .764 isn't provide much resistance at all. Now it could be 18000 or .886 to provide a certain resistance.
My guess is, the market strength could even bring us to 18351 or slightly higher (1.618 extension shown on monthly chart).

hsi - A guess of coming pattern

the graph is showing, what I believe, a signal of a possible swing bottom:
1/ hold above 223xx; 2/ hold above internal line
Below is my guess of coming pattern:

2015年10月14日 星期三
883 td 20151014

low of today is 8.90 which is almost the .333 level of retracement between 9.60 & 7.41. If it is valid, it may reach a 100%-161.8% extension of the range of 9.60 & 7.41, that is 11.07/11.67/12.42. Personally, I think 11.67 is more likely than the others (see also http://koei1024.blogspot.hk/2015/10/883-monthly-weely-review.html).

2015年10月12日 星期一
USD/CNY 20151012

Although I am not a forex trader, I am continuously monitoring on some major or related exchange rates to me, e.g. EUR/USD, USD/IDR, USD/KRW. USD/CNY is one of them on my list.
The old swing bottom and top in year 2012 had significant effect on the movements until now, as shown in above chart.

2015年10月11日 星期日
883 monthly & weely review

883.hk/CNOOC was one of the stocks+indexes that I traded since 2007, the time I jumped into the market without adequate knowledge, and is still trading & monitoring. One of the reasons I am still trading it is that I earned for some times of sweat sums of money by trading its derivatives in 2008, and fewer occurrence than other stocks in having a loss upto this moment.
Obviously, this is undergoing a downward channel for years, and I was lucky enough in catching some tops & bottoms. And now, a critical moment has come - a potential bottom reaching the channel lower boundary, plus testing a nice retracement level, .786.
Its main trend is going down (downward channel) since there are lower-top-lower-bottomg according to its 3-bar monthly chart, many of the swing bottoms have already been broken. Although it is TOO far, there is a possible support at 3.83... (6 dollars lower from 9.27 or -64.7%...) obviously not a useful reference... 0.886 could be a higher support but still not much of practical use ...

By measuring each up & down moves, there are some noticeable tendency since 2011:
For down move, weeks taken are either 15-17 or 25-26; size is from 5.02-6.16 (10.20 excluded for a channel scenario)
For up move, weeks taken are either 19-22 (12 & 30 excluded); size is from 4.06-4.46 (7.08 excluded)
If the end of Oct. 2nd 2015 is a low and we try to project the coming up move from this point, I would expect a swing size of about 4 (I put 4.46 on the 2nd chart) and last for about 20 weeks. the projected price target is close to .618-.667 level between 13.70-7.41 which add to the meaningfulness of this projection.
Before that happen, a minor swing top at about 10.16 could be an important resistance, in order to identify change in a minor trend.

If the rebound is failed, it could land around 5.82-6.0 (.886 retracement level and a swing bottom) or even lower.
2015年10月9日 星期五

hsi resistance 20151009

fibo retracement levels 285-203:
23508 (.382)
24478 (.50)
25448 (.618)
26649 (.764)
1st target - 244-248 (or even 255)
2nd target (after a possible retracemtent, if a zig-zag ABC wave) - 265-270
2015年10月7日 星期三
有趣鞭策/鞭屍
現在會唔會有人突然又覺得恆指今年應該見3萬點以上呢, 等我鞭下屍先:
https://zh-hk.facebook.com/yeungwailung/posts/735807316461117
https://hk.finance.yahoo.com/news/%E6%B8%A3%E6%89%93%E6%A2%81%E6%8C%AF%E8%BC%9D%E6%96%99%E6%81%92%E6%8C%87%E8%A9%A6%E4%B8%89%E8%90%AC%E9%BB%9Eh%E8%82%A1%E4%BB%8D%E5%84%AA%E6%96%BCa%E8%82%A1-055400195--finance.html
http://www.on.cc/hk/bkn/cnt/finance/20150623/bkn-20150623144343512-0623_00842_001.html
http://www.dbc.hk/digitalmedia-detail/Id/56036/type/94/%E3%80%90%E6%B4%AA%E7%81%9D%E5%8D%9A%E5%AE%A2%E3%80%91%E6%81%86%E6%8C%87%E7%9B%AE%E6%A8%993%E8%90%AC2%20%E8%88%87%E3%80%8C%E4%B8%AD%E5%9C%8B%E5%A4%A7%E5%AA%BD%E3%80%8D%E9%A0%86%E5%8B%A2%E8%80%8C%E7%82%BA
http://www.etnet.com.hk/www/tc/news/categorized_news_detail.php?category=latest&newsid=ETN250623415
預測/估估下個個人都識 (opinions are like assholes, everyone has one...), 亦人人都會有錯, 我都成日自我鞭策 (=鞭屍), 事關 trading world 唔係睇一個人估得有幾準, 而係睇一個人估得準時做得啱唔啱 (let the profit run), 估錯O既時候又做得啱唔啱 (cut loss fast), in long run 做到賺比蝕為多, 所以量度O既時間係一世, 不爭朝夕.
2015年10月5日 星期一
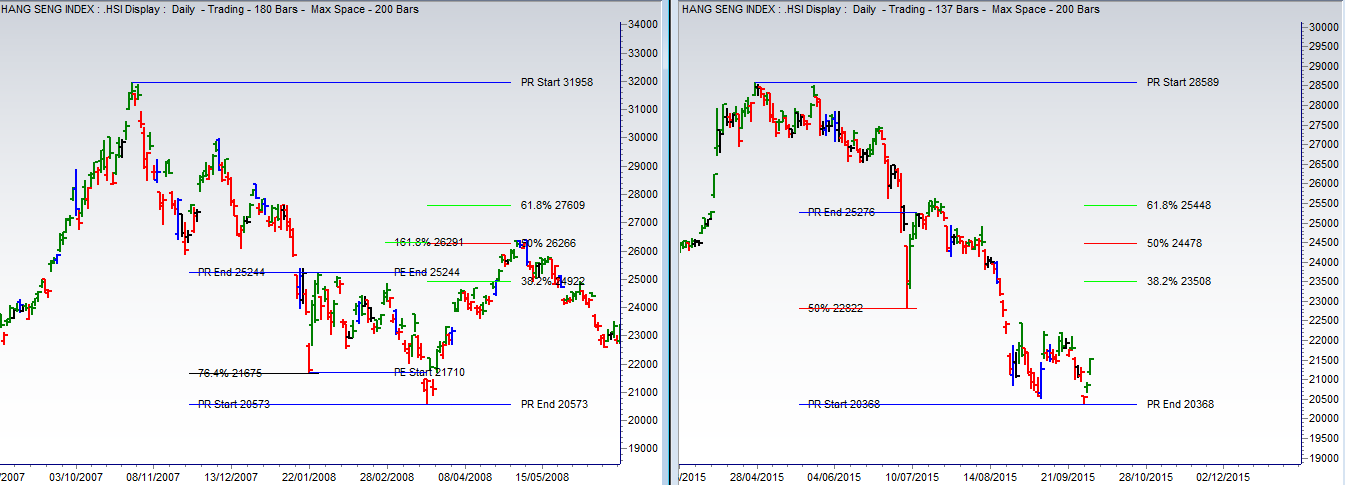
hsi 2015 vs 2007 vs 1997 - follow-up
http://koei1024.blogspot.hk/2015/08/hsi-2015-vs-2007-vs-1997.html

1997 scenario is no longer matching... 2007 still works...
1997 scenario is no longer matching... 2007 still works...

2015年10月3日 星期六
dji short and long term views
Yesterday night before going to sleep, US market seemed to finish an ABC correction with its B wave 0.66 of C wave:

thereafter, a nice break-out followed

Macroscopically, US market looks like undergoing a series of similar expansion throughout last 2 decades:


monthly closing prices are pretty close to .618 (note this is a backward induction where its reciprocal is 1.618 a universal expansion rate). In general, it could be an expanding triangle or wedge that doom-day analysts may think there will be an End-of-the-world scenario (not End-of-Day... everything with a beginning has an end...) with a total market collapse to just a few thousand points (dji: 5847 if the same proportion is applied) ... Before that happens, looking at the fibo levels between 6470 && 18351 is more realistic at the moment, e.g. .382, .50, .618...

Looking at its 3-bar weekly swing charts, there are two swing bottoms (17038,15855) broken since the fall from end May 2015, but stopped above 15341. Therefore, a change in trend is confirmed.
Similar to hsi 's current situation, before the termination comes, I would expect a retracement to the north. 16933 is far too low to be the final point of this counter-wave.

From its 2-bar weekly swing chart, one of the possible targets could be 17466 which was a swing bottom in week of July 11th 2015.

From a geometric point of view, US market has also broken a weekly support trend line extrapolated from March 2009 and October 2011. Interestingly, when we apply a parallel trend line starting from the top in early Jan 2014, the market follows without violation.
If templates of Gartley pattern are applied, we could find some proportional relationships as shown in below charts:

If 15370 fits to .382, the market should follow with a retracement to the north and then try to find support at 14378 (0.50), 13440 (0.618) or 12280 (0.764) or even 1.000.
10404 is quite interesting since it is 102x102, a "square" number.

If 15370 fits to .50, the market should follow with a retracement to the north and then try to find support at 14718 (0.618) or 13859 (0.764) or even 1.000.

thereafter, a nice break-out followed


Looking at its 3-bar weekly swing charts, there are two swing bottoms (17038,15855) broken since the fall from end May 2015, but stopped above 15341. Therefore, a change in trend is confirmed.
Similar to hsi 's current situation, before the termination comes, I would expect a retracement to the north. 16933 is far too low to be the final point of this counter-wave.


If templates of Gartley pattern are applied, we could find some proportional relationships as shown in below charts:

If 15370 fits to .382, the market should follow with a retracement to the north and then try to find support at 14378 (0.50), 13440 (0.618) or 12280 (0.764) or even 1.000.
10404 is quite interesting since it is 102x102, a "square" number.

訂閱:
文章 (Atom)