2016年6月30日 星期四
2016年6月27日 星期一
hsi vs. cruel oil 20160627
20,000 or even 18,000 levels for hsi hardly provide any support, a few people have been watching for 15000 level. Among the views I have seen, mine is the most bearish. I hope it wouldn't happen, but if it does, there will be 30-40% off from the current position as I shared with my friends some months ago...
no surprise if one thinks about the econ downturn (look like structural 'adjustment'), Brexit which results in a demolition of EU wholly / partly. If some defaults happen at a national level (e.g. Venezuela), a perfect storm could occur...
2016年6月23日 星期四
2016年6月22日 星期三
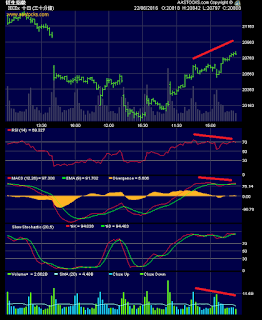
any resistance at 208xx level?
as this retracement reaches 208xx level, there are potential signal from indicators which provides a certain resistance or even marks an end of this turn. let's see what will happen tomorrow, Brexit or Brstay
2016年6月21日 星期二
Can the same cycle of real estate in US be applied to HK?
(extracted from the book "Technical Analysis for Trading Professional 2nd Edition" by Constance Brown)
It is my 3rd time reading this book since 2009, every time I found there is something I missed and rediscovered and this time from its 2nd edition.
From what Mr. Edward Dewey discovered from US real estate data in the past, a cycle of 18 1/3 years was found.


Can we apply the same cycle to HK real estate? The answer is yes if we consider 1997 and a recent top in 2015. A further verification seems hard due to the lack of real estate data in the old days...
More interestingly, the contraction/down time is about 1/3 or 0.333 of the cycle (74 months from June 1997 to Aug. 2003); expansion is about 2/3 or 0.666.
When will the coming bottom end? IF the cycle holds and we simply add 18.333 years or 220 months to the bottom in Aug. 2003, it would be Dec. 2021...
It is my 3rd time reading this book since 2009, every time I found there is something I missed and rediscovered and this time from its 2nd edition.
From what Mr. Edward Dewey discovered from US real estate data in the past, a cycle of 18 1/3 years was found.


Can we apply the same cycle to HK real estate? The answer is yes if we consider 1997 and a recent top in 2015. A further verification seems hard due to the lack of real estate data in the old days...
More interestingly, the contraction/down time is about 1/3 or 0.333 of the cycle (74 months from June 1997 to Aug. 2003); expansion is about 2/3 or 0.666.
When will the coming bottom end? IF the cycle holds and we simply add 18.333 years or 220 months to the bottom in Aug. 2003, it would be Dec. 2021...
2016年6月17日 星期五
Markets at a glance 20160617
訂閱:
文章 (Atom)


