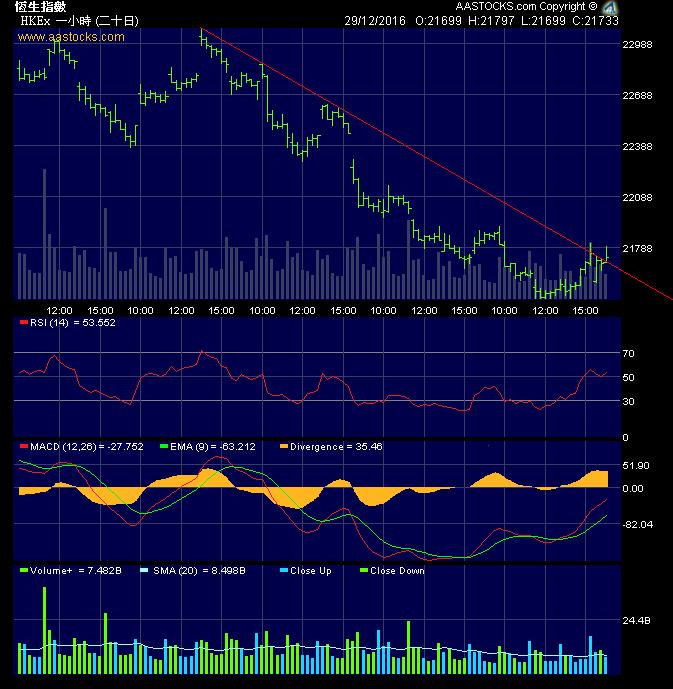
2016年12月29日 星期四
2016年12月21日 星期三

2016年12月19日 星期一

SP500 (CFD) diamond top
diamond top isn't a common pattern. When it is confirmed, the force of reversal could be very strong...


2016年12月15日 星期四


2016年12月13日 星期二


2016年12月12日 星期一

2016年11月24日 星期四

2016年11月17日 星期四
hsi - trade with the bigger trend

we always talk about the main trend, it merely depends on what timeframe we are trading. If someone is trading for a few hours/days, just follow the trend in the weekly/monthly chart which would give us a higher probability to be correct with a higher downward momentum in downtrend, vice versa.
hsi td downward channel

a rough idea of market trend
Swing trading chart, see if you can notice a change in trend :

2016年11月16日 星期三
當人口老化遇上拒當樓奴潮
人口老化, 手上有資產會賣出以過日, 樓宇供應增加, equlibrium price 下跌;

年青一代拒當樓奴, 樓宇需求下降, Qp 下跌.
https://hk.news.yahoo.com/%E9%9D%92%E5%B9%B4%E6%8B%92%E7%95%B6%E6%A8%93%E5%A5%B4-%E5%83%8527-%E6%93%AC%E7%BD%AE%E6%A5%AD-225519867.html
香港政府土地供應由近二十年嘅低位拉扯向上, 樓宇供應增加, Qp 下跌...
http://www.info.gov.hk/gia/general/201611/16/P2016111600443.htm
黎緊30年, 投資私人住宅市場, 係長升長有, 定長跌長有, 定係橫行呢?

年青一代拒當樓奴, 樓宇需求下降, Qp 下跌.
https://hk.news.yahoo.com/%E9%9D%92%E5%B9%B4%E6%8B%92%E7%95%B6%E6%A8%93%E5%A5%B4-%E5%83%8527-%E6%93%AC%E7%BD%AE%E6%A5%AD-225519867.html
香港政府土地供應由近二十年嘅低位拉扯向上, 樓宇供應增加, Qp 下跌...
黎緊30年, 投資私人住宅市場, 係長升長有, 定長跌長有, 定係橫行呢?
2016年11月14日 星期一

learning from the past: HSI vs DJI

For easier comparison, the two charts are in semi-log and both start with a major historical low (DJI: the great depression; HSI: during 1973-74, the index dropped 91.54%...). In my point of view, it is a kind of consolidation/sideways in a large scale before the next dominant up trend comes.
I generally believe a bottom near 161 or 106 in order to reversing the trend from de-leveraging process.
hsi-wk-zic-zac-abc-correction - follow-up
http://koei1024.blogspot.hk/2016/08/hsi-wk-zic-zac-abc-correction.html
a typical waveform in a long term down trend, we are either near the turning point of a B wave of ABC correction or II wave of I-II-III-IV-V wave. Considering the macroscopic view of a consolidation pattern from 1996 until (roughly) 2020, personally a ABC correction is more preferred.


a typical waveform in a long term down trend, we are either near the turning point of a B wave of ABC correction or II wave of I-II-III-IV-V wave. Considering the macroscopic view of a consolidation pattern from 1996 until (roughly) 2020, personally a ABC correction is more preferred.


2016年8月31日 星期三

2016年8月26日 星期五
AB=CD pattern - hsi, 1928
it's quite common to find a AB=CD pattern within a shorter timeframe. when it appears, it is rather a good trade with high gain:loss ratio.
AB=CD patterns sometimes could be a counter-trend movement, which is similar to a wave 2/4 of an impulsive wave; wave B of a correction wave. Market followers can easily recognize them and can even prepare to make use of them in order to trade with trend.


AB=CD patterns sometimes could be a counter-trend movement, which is similar to a wave 2/4 of an impulsive wave; wave B of a correction wave. Market followers can easily recognize them and can even prepare to make use of them in order to trade with trend.


Book name: Trade what you see - How to profit from pattern recognition
Author: Larry Lesavento, Leslie Jouflas
hsce 30min 20160825 - follow up

it is not a bad trading tool, it gives the target and the stop (crossing the previous top when long put).
http://koei1024.blogspot.hk/2016/08/hsce-30min-20160825.html
2016年8月25日 星期四

hsce 30min 20160825

the bounce target shouldn't exceed the previous top and RSI negative reversal will be perfect. Look for RSI reach around 60.
2016年8月23日 星期二
hsi 20160823

Weekly and daily are both currently inside bars, need to wait for an explosion ignited by sth...


2016年8月17日 星期三
Reversal - a top or bottom?
Expected a bottom on Aug. 16th 2016 but most likely a top... coincide with the annoucement of Shenzhen-Hong Kong Stock Connect 深港通...
http://koei1024.blogspot.hk/2016/08/hsi-td-20160803.html
http://koei1024.blogspot.hk/2016/07/hsi-time-projection-20160726.html
http://koei1024.blogspot.hk/2016/08/hsi-td-20160803.html
http://koei1024.blogspot.hk/2016/07/hsi-time-projection-20160726.html
2016年8月15日 星期一
hsi wk zic zac ABC correction

A more reasonable assumption would be a ABC correction wave
http://stockcharts.com/school/doku.php?id=chart_school:market_analysis:elliott_wave_theory

hsi td 20160812 AB=CD

if 22976 is the final destination of this turn, it will be a perfect AB=CD pattern/scenario (though time factor not 1:1). 22977 is also a price -315 degree from 28589.
hsce wk 20160815 - RSI bearish range upper limit

market has risen to a level with very high potential to reverse when referring to historical price movements, here is just using the data from the past 8 years and should be more fascinating if one studies over a longer period/other time frame
2016年8月3日 星期三
hsi td 20160803

hsce 5-min 20160803

2016年8月1日 星期一
hsce 20160801 - symmetrical broadening top

A symmetrical broadening top? Let's see

http://www.forex-tribe.com/Symmetrical-Broadening-Top.php
2016年7月27日 星期三
hsi time projection 20160726
I think July 26th is a potential top for quite a while

see also below link:

see also below link:
hsi time projection 20160216

2016年7月25日 星期一
Crude oil - more examples of RSI reversals and divergences

I agree that this method can only be used to provide an idea, not always suitable for trading purpose or should use other tools/methods to counter-confirm these signals.
2016年7月19日 星期二
hsi wk - RSI negative reversal


one of the analytic methods; real life trading needs other tools to confirm these signals
2016年7月18日 星期一

2016年7月15日 星期五
hsi 2000 vs 2015 - time comparison

Case 1 - a re-test of 18000 level before resuming a bullish cycle
there seems to have a 'M' shape pattern (the bigger green circles) developing since1st half of 2016 until today. If time of 41 weeks accounts as 1/2 of the whole bearish cycle, a re-test of 18000 level would be expected by Jan. 2017 before a bullish cycle resumes (some problem with the time indication on the chart, same as below)

If time of 41 weeks accounts as 1/3 of the whole bearish cycle, the coming heavy sell-off would end by Jan. 2017, and a vigorous rebounce to an old bottom (~18000 level) and move in sideway from range 13000 - 18000 before a bullish cycle resumes
2016年7月7日 星期四
hsi - study of bearish cycles, compare with times of dot-com bubble

For a 'normal' bearish move, it takes about 12 months to complete. An exceptional case within the last 20-30 years is the down move from March 2000, the burst of dot-com bubble. It took 37 months to complete and more precisely it took 18 months to a half-way (in terms of duration) bottom very close to the destination and then took another 19 months to consolidate in a range (8000-12000) before everything headed north.
My concern is:
If we follow a 12-month bearish cycle, the impoverishing game is over and we can sleep well from now on.
However, if the current bearish down move imitates that of the dot-com bubble, we will still have 3 months (Oct-Nov 2016) to see a bottom close enough to the end of bearish market.

Take a closer look at the index from March 2000 to April 2003 versus the current condition (from May 2015 '大時代'). From a naked eye, there are quite many similarities in the two different periods:
1/ a Zig-zac wave A:
2000 - hsi dropped 4232 pts from July 22 to Dec. 2, 2000 which is almost the same as the down move from Feb. 3 to Apr. 14 2001, 4213 pts. Also a AB=CD;
2015 - hsi dropped 8220 pts as wave 'a' and 5145 pts in wave 'c' almost 0.618 of wave 'a'.
2000 - wave 'B' (1928 pts) is about 1/3 of wave 'A' (6064 pts)
2015 - wave 'B' (3375 pts) is almost 1/3 of wave 'A' (10310 pts)
3/ wave 'C' about 2.618 times of wave 'B'
2000 - wave 'C' (5095 pts) is about 2.618 times of wave 'B' (1928 pts)
2015 - can we expect 12818 (21654 - 3375 x 2.618)? if it is 1.618, it would be 16193; 2 times, 14904
Lastly, I hope the historical supporting trend line (the same blue line in both charts) are still valid (provided an extension less than or equal to 2 times of point 3/), so my job in future is easier just to buy near the line and hold for many years....
(July 26, 2016: some violation of Elliot wave count principles ... anyway, just for reference)
訂閱:
文章 (Atom)