2015年10月14日 星期三

883 td 20151014


low of today is 8.90 which is almost the .333 level of retracement between 9.60 & 7.41. If it is valid, it may reach a 100%-161.8% extension of the range of 9.60 & 7.41, that is 11.07/11.67/12.42. Personally, I think 11.67 is more likely than the others (see also http://koei1024.blogspot.hk/2015/10/883-monthly-weely-review.html).


2015年10月12日 星期一

USD/CNY 20151012


Although I am not a forex trader, I am continuously monitoring on some major or related exchange rates to me, e.g. EUR/USD, USD/IDR, USD/KRW. USD/CNY is one of them on my list.

The old swing bottom and top in year 2012 had significant effect on the movements until now, as shown in above chart.


I currently assume USD/CNY has finished an ABC correction wave with the size of wave C approx. 1.50 times that of wave A. My primary target could be either fibo levels, but if it could find a support on trend line extrapolated from 6.0395 & 6.1072 in early & end of 2014 respectively, roughly 6.19-6.21 level, it could be nicer.

2015年10月11日 星期日

883 monthly & weely review


883.hk/CNOOC was one of the stocks+indexes that I traded since 2007, the time I jumped into the market without adequate knowledge, and is still trading & monitoring. One of the reasons I am still trading it is that I earned for some times of sweat sums of money by trading its derivatives in 2008, and fewer occurrence than other stocks in having a loss upto this moment.

Obviously, this is undergoing a downward channel for years, and I was lucky enough in catching some tops & bottoms. And now, a critical moment has come - a potential bottom reaching the channel lower boundary, plus testing a nice retracement level, .786.

Its main trend is going down (downward channel) since there are lower-top-lower-bottomg according to its 3-bar monthly chart, many of the swing bottoms have already been broken. Although it is TOO far, there is a possible support at 3.83... (6 dollars lower from 9.27 or -64.7%...) obviously not a useful reference... 0.886 could be a higher support but still not much of practical use ...


By measuring each up & down moves, there are some noticeable tendency since 2011: 

For down move, weeks taken are either 15-17 or 25-26; size is from 5.02-6.16 (10.20 excluded for a channel scenario)

For up move, weeks taken are either 19-22 (12 & 30 excluded); size is from 4.06-4.46 (7.08 excluded)

If the end of Oct. 2nd 2015 is a low and we try to project the coming up move from this point, I would expect a swing size of about 4 (I put 4.46 on the 2nd chart) and last for about 20 weeks. the projected price target is close to .618-.667 level between 13.70-7.41 which add to the meaningfulness of this projection.

Before that happen, a minor swing top at about 10.16 could be an important resistance, in order to identify change in a minor trend.


If the rebound is failed, it could land around 5.82-6.0 (.886 retracement level and a swing bottom) or even lower.

2015年10月9日 星期五

hsi wk 20151009


break-out with increased volume (compare with volumes of recent weeks), a good sign

hsi resistance 20151009


fibo retracement levels 285-203:

23508 (.382)
24478 (.50)
25448 (.618)
26649 (.764)

1st target - 244-248 (or even 255)
2nd target (after a possible retracemtent, if a zig-zag ABC wave) - 265-270

2015年10月3日 星期六

dji short and long term views

Yesterday night before going to sleep, US market seemed to finish an ABC correction with its B wave 0.66 of C wave:

thereafter, a nice break-out followed

Macroscopically, US market looks like undergoing a series of similar expansion throughout last 2 decades:


monthly closing prices are pretty close to .618 (note this is a backward induction where its reciprocal is 1.618 a universal expansion rate). In general, it could be an expanding triangle or wedge that doom-day analysts may think there will be an End-of-the-world scenario (not End-of-Day... everything with a beginning has an end...) with a total market collapse to just a few thousand points (dji: 5847 if the same proportion is applied) ... Before that happens, looking at the fibo levels between 6470 && 18351 is more realistic at the moment, e.g. .382, .50, .618...


Looking at its 3-bar weekly swing charts, there are two swing bottoms (17038,15855) broken since the fall from end May 2015, but stopped above 15341. Therefore, a change in trend is confirmed.

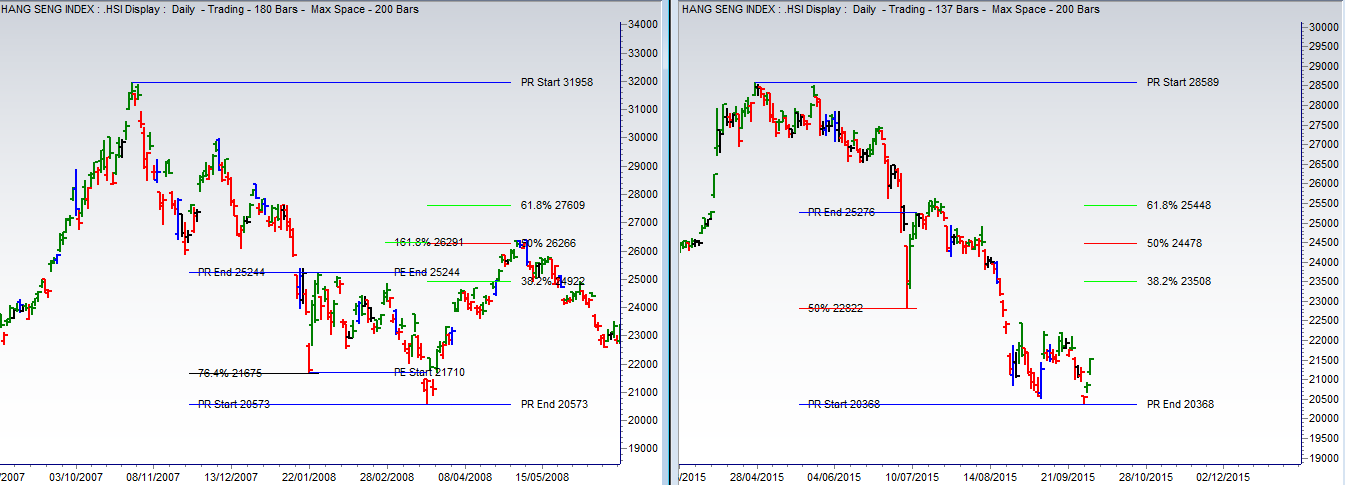
Similar to hsi 's current situation, before the termination comes, I would expect a retracement to the north. 16933 is far too low to be the final point of this counter-wave.


From its 2-bar weekly swing chart, one of the possible targets could be 17466 which was a swing bottom in week of July 11th 2015.


From a geometric point of view, US market has also broken a weekly support trend line extrapolated from March 2009 and October 2011. Interestingly, when we apply a parallel trend line starting from the top in early Jan 2014, the market follows without violation.

If templates of Gartley pattern are applied, we could find some proportional relationships as shown in below charts:


If 15370 fits to .382, the market should follow with a retracement to the north and then try to find support at 14378 (0.50), 13440 (0.618) or 12280 (0.764) or even 1.000.

10404 is quite interesting since it is 102x102, a "square" number.


If 15370 fits to .50, the market should follow with a retracement to the north and then try to find support at 14718 (0.618) or 13859 (0.764) or even 1.000.