
2014年12月15日 星期一
2014年12月10日 星期三
883 bottom projection 20141210

Price below 10 will be VERY attractive if we look back 1-2 years later

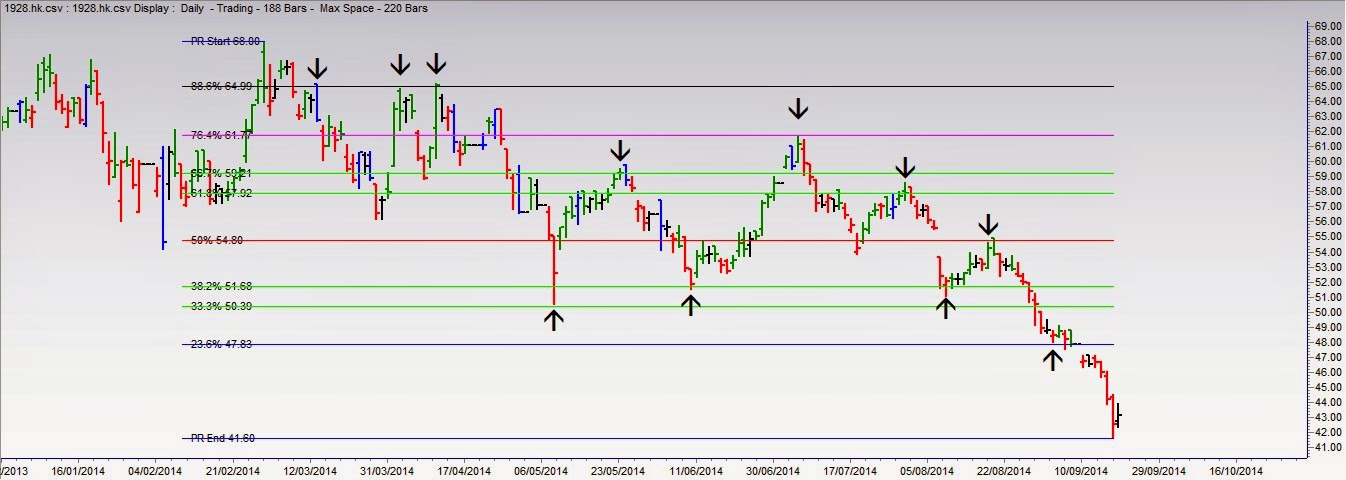
1928 td 20141210

previous assumption was violated when bottom line of asymmetrical triangle was broken.
as the price sinks, a strong buying signal/pattern is in development - double bottom.
Time, this rebound could last until end Dec. or early Jan.
Price, probably 53-54
2840 wk 20141209


sse vs dji 1931-1950

2014年11月28日 星期五
1928 Symmetrical Triangle 20141128
criteria:
1/ contracting swing/wave? yes
2/ declining volume? yes
3/ 4/ 5/....
note this is a continuation pattern, that means the original trend will usually resume after the pattern has completed...
fyi, line chart below is much easier to recognize this pattern projection of price according to website of this classical pattern is the the difference between first top and second bottom, approximately 55-56
http://stockcharts.com/school/doku.php?id=chart_school:chart_analysis:chart_patterns:symmetrical_triangle_continuation

.png)

1/ contracting swing/wave? yes
2/ declining volume? yes
3/ 4/ 5/....
note this is a continuation pattern, that means the original trend will usually resume after the pattern has completed...
fyi, line chart below is much easier to recognize this pattern projection of price according to website of this classical pattern is the the difference between first top and second bottom, approximately 55-56
http://stockcharts.com/school/doku.php?id=chart_school:chart_analysis:chart_patterns:symmetrical_triangle_continuation
.png&container=blogger&gadget=a&rewriteMime=image%2F*)
2014年11月26日 星期三
hsi two hypothetical patterns 20141127

since the swings are proportional (see below chart), I think there are 2 possibilities:
hypo. 1 (pink lines on right): A-B-C correction to the upside, that A (zig-zag) started from 22566 to 24133,
B (expanded flat) started from 24133 to 23253;
C now starts from 23253
hypo. 2 (red & white lines on left): symmetrical' broadening top, that likely to touch the upper and lower trend lines once more
I think hypo. 1 is more likely

2014年11月22日 星期六

883 20141121


Dax weekly 20141122
20141121235848.png)
a so-called 'symmetrical' broadening top, this turn will reach 10500 or higher
hypothesis 2:
a downward channel if this turn does not break the downtrend from 10050 and 9891
I think hypo 1 may have higher chance

http://education.howthemarketworks.com/stocks/intermediate/chartpatterns/symmetrical-broadening-top/
2014年11月7日 星期五
883 monthly 20141107

1928 short term CIT + leg

It is expected a sharp surge to around 55 level. Time would be mid-end Nov.

2014年10月17日 星期五
1928 20141017

2/ (daily) broke the swing top@43.75 on Oct. 7th;
3/ (daily) today's volume is almost (or even higher at today's closed) that of Oct. 7th, could also be possible for a valid CIT;
4/ most importantly, Oct. 16th is one of the most important turning points within 2014.

2014年10月9日 星期四
Gold/2840.hk 3rd time at same level

- temporarily broke 892 but close at higher level, a nice false break
- intermediate turning point quite close to 0.667 or 2/3, projection in terms of time still works
- counter-trend bounce is expected until mid Dec., may touch green line again or around 950
http://koei1024.blogspot.hk/2014/09/2840-gold-etf-update-20140923.html
2014年10月5日 星期日
study of 1928's gartley pattern and ratios

XA-AB-BC-CD and their inter-relationship
I assume X starts at 20.65 (not 33.50 this time) and A at 68.00


2014年10月3日 星期五
US index 20141003
20141003230201.png)
the index has undergone an expanded (flat correction wave) A-B-C, ratio here is quite rare which is 3.14*A=C
20141003230244%2Bb.png)
2014年9月23日 星期二
2840 (gold etf) update 20140923

Time projection to May 2015 for final bottom this intermediate term
http://blogcity.me/blog/reply_blog_edit.asp?f=Y5FN0M3HNS239764&id=623097
2014年9月19日 星期五
1928 finished wave A


0.75 A = A (c)
2.236 x A (c) a' = A (c) c'
Below is a very nice picture of how stock respect fibo at different levels. closes around these levels also count. Plus one weekly signal bottom bar pattern after a decline lasted for months, so...
(in addition to whether .764 vs .786 or .618 vs .666 or .382 vs .333, one can assume either of them in advance if we know nothing of the subject under study. After viewing into the past data, one should know the tendency of which to use or similar/uncertain chance in occurrence)
2014年9月12日 星期五
883 & 939 wk 20140911

(level of top adjusted)

2014年9月11日 星期四

2014年8月21日 星期四

2014年8月1日 星期五
key reversal bar pattern, high volume, what's more?
key reversal bar pattern, high volume (similar to mid Apr), what's more?
2014年7月29日 星期二

2014年7月23日 星期三
new break-out? or near the end?

http://thepatternsite.com/EWDiagTriangle.html

Therefore, we better try to understand it as a corrective wave condition. the lower and upper trendlines are converging and it is possible for a temporary throw-over as Mr. Bulkowski suggested.
What we need to wait is whether the market falls back to the area within the red triangle and initiate an reversal.
Indicators like MACD is shrinking which could lead to a break-out or sideway situation.
Volume is also shrinking with higher top, which could be a dangerous signal to bullish view. meaning buying power to support higher top is weakening.

there are 2 possible target of the c3 of C wave: 23947-23979, and 24152-24153
These are the extension from the a wave of c3 and A respectively.
I also added an old top 24111 in Dec. 2013 as a reference point.
2014年7月20日 星期日
1928 possible gartley pattern


sp500 target

2014年7月17日 星期四

2014年7月15日 星期二

訂閱:
文章 (Atom)