
2016年8月3日 星期三
hsce 5-min 20160803

2016年8月1日 星期一
hsce 20160801 - symmetrical broadening top

A symmetrical broadening top? Let's see

http://www.forex-tribe.com/Symmetrical-Broadening-Top.php
2016年7月27日 星期三
hsi time projection 20160726
I think July 26th is a potential top for quite a while

see also below link:

see also below link:
hsi time projection 20160216

2016年7月25日 星期一
Crude oil - more examples of RSI reversals and divergences

I agree that this method can only be used to provide an idea, not always suitable for trading purpose or should use other tools/methods to counter-confirm these signals.
2016年7月19日 星期二
hsi wk - RSI negative reversal


one of the analytic methods; real life trading needs other tools to confirm these signals
2016年7月18日 星期一

2016年7月15日 星期五
hsi 2000 vs 2015 - time comparison

Case 1 - a re-test of 18000 level before resuming a bullish cycle
there seems to have a 'M' shape pattern (the bigger green circles) developing since1st half of 2016 until today. If time of 41 weeks accounts as 1/2 of the whole bearish cycle, a re-test of 18000 level would be expected by Jan. 2017 before a bullish cycle resumes (some problem with the time indication on the chart, same as below)

If time of 41 weeks accounts as 1/3 of the whole bearish cycle, the coming heavy sell-off would end by Jan. 2017, and a vigorous rebounce to an old bottom (~18000 level) and move in sideway from range 13000 - 18000 before a bullish cycle resumes
2016年7月7日 星期四
hsi - study of bearish cycles, compare with times of dot-com bubble

For a 'normal' bearish move, it takes about 12 months to complete. An exceptional case within the last 20-30 years is the down move from March 2000, the burst of dot-com bubble. It took 37 months to complete and more precisely it took 18 months to a half-way (in terms of duration) bottom very close to the destination and then took another 19 months to consolidate in a range (8000-12000) before everything headed north.
My concern is:
If we follow a 12-month bearish cycle, the impoverishing game is over and we can sleep well from now on.
However, if the current bearish down move imitates that of the dot-com bubble, we will still have 3 months (Oct-Nov 2016) to see a bottom close enough to the end of bearish market.

Take a closer look at the index from March 2000 to April 2003 versus the current condition (from May 2015 '大時代'). From a naked eye, there are quite many similarities in the two different periods:
1/ a Zig-zac wave A:
2000 - hsi dropped 4232 pts from July 22 to Dec. 2, 2000 which is almost the same as the down move from Feb. 3 to Apr. 14 2001, 4213 pts. Also a AB=CD;
2015 - hsi dropped 8220 pts as wave 'a' and 5145 pts in wave 'c' almost 0.618 of wave 'a'.
2000 - wave 'B' (1928 pts) is about 1/3 of wave 'A' (6064 pts)
2015 - wave 'B' (3375 pts) is almost 1/3 of wave 'A' (10310 pts)
3/ wave 'C' about 2.618 times of wave 'B'
2000 - wave 'C' (5095 pts) is about 2.618 times of wave 'B' (1928 pts)
2015 - can we expect 12818 (21654 - 3375 x 2.618)? if it is 1.618, it would be 16193; 2 times, 14904
Lastly, I hope the historical supporting trend line (the same blue line in both charts) are still valid (provided an extension less than or equal to 2 times of point 3/), so my job in future is easier just to buy near the line and hold for many years....
(July 26, 2016: some violation of Elliot wave count principles ... anyway, just for reference)
hsi - contracting triangle 20160706

Now it is near the end of the tunnel...
2016年6月30日 星期四


2016年6月27日 星期一
hsi vs. cruel oil 20160627

20,000 or even 18,000 levels for hsi hardly provide any support, a few people have been watching for 15000 level. Among the views I have seen, mine is the most bearish. I hope it wouldn't happen, but if it does, there will be 30-40% off from the current position as I shared with my friends some months ago...
no surprise if one thinks about the econ downturn (look like structural 'adjustment'), Brexit which results in a demolition of EU wholly / partly. If some defaults happen at a national level (e.g. Venezuela), a perfect storm could occur...
2016年6月23日 星期四


2016年6月22日 星期三
any resistance at 208xx level?
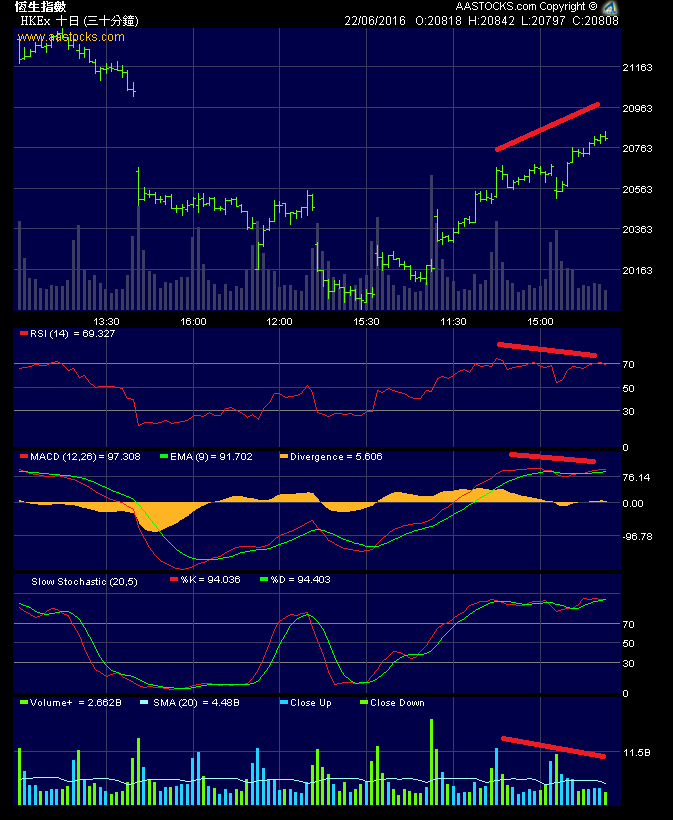

as this retracement reaches 208xx level, there are potential signal from indicators which provides a certain resistance or even marks an end of this turn. let's see what will happen tomorrow, Brexit or Brstay
2016年6月21日 星期二
Can the same cycle of real estate in US be applied to HK?
(extracted from the book "Technical Analysis for Trading Professional 2nd Edition" by Constance Brown)
It is my 3rd time reading this book since 2009, every time I found there is something I missed and rediscovered and this time from its 2nd edition.
From what Mr. Edward Dewey discovered from US real estate data in the past, a cycle of 18 1/3 years was found.


Can we apply the same cycle to HK real estate? The answer is yes if we consider 1997 and a recent top in 2015. A further verification seems hard due to the lack of real estate data in the old days...
More interestingly, the contraction/down time is about 1/3 or 0.333 of the cycle (74 months from June 1997 to Aug. 2003); expansion is about 2/3 or 0.666.
When will the coming bottom end? IF the cycle holds and we simply add 18.333 years or 220 months to the bottom in Aug. 2003, it would be Dec. 2021...
2016年6月17日 星期五
Markets at a glance 20160617


Some markets have clearer pictures, e.g. head-and-shoulder top, break of supporting trendline; while some are not, e.g. DJI/SP500,
2016年5月27日 星期五

2016年5月11日 星期三
HSI-CFD 20160511

downtrend in effect, if it makes a continuation pattern in current level (200xx-203xx), probably the extension of wave will not just reach 194xx ...

a potential continuation pattern ('slightly' expanded ABC correction wave, or even a triangle). after a break-thru, it could be about 1000 pts down (or upward with less momentum but less likely).
2016年4月27日 星期三
time to change a trend?
Some stocks have made clear moves earlier than others, e.g. 700, 2628, with a break out from an inside weekly bar


while hsi, 883, 388 appear to be still making inside bars


2016年4月7日 星期四
cruel oil 5-hr 20160407

It is sooooooo harmonic!!!
1) its internal wave structure;
2) proportional move roughly a AB=CD pattern;
3) retracement levels: 0.500 and 0.666
2016年4月6日 星期三
hsi td 20160405
208XX level was one of the most important level for this rebound, ratios tell everything.
In addition, geometric resistance of the trend line (in blue); classical pattern is found - double top.
These three elements confirm each other.
(mechanical stop@2% was hit today, started at the 18868 bottom)


In addition, geometric resistance of the trend line (in blue); classical pattern is found - double top.
These three elements confirm each other.
(mechanical stop@2% was hit today, started at the 18868 bottom)


2016年4月5日 星期二
883 td 20160405 (break-away gap)
a ref. of break-away gap from an online source (http://www.tradingday.com/c/tatuto/thegapprimer.html) :


What's happening here:
- a break-away gap after a break-thru of consolidation area (contracting triangle/wedge, whatever)
- last time the stock showed the same combo of break-thru+break away gap was in Aug-Sep. 2014. This marked a beginning of the downtrend, see if it will do the same this time
2016年4月1日 星期五

2016年3月31日 星期四
hsi time and price projection 20160331 - follow-up
http://koei1024.blogspot.hk/2016/02/hsi-td-20160215.html
http://koei1024.blogspot.hk/2016/02/hsi-time-projection-20160216.html

as 1.333 and 1.382 indicated minor bottoms, I expect 1.50 time extension could be a major top +/- 1 trading day and a bottom near mid April.

Both 1st (208xx-20100) and 2nd (203xx-205xx) price targets were achieved, and there is a high possibility for a major top at 208xx level.

2016年3月30日 星期三
SP500 futures+ crude oil

it seems to be a scenario of both 1/ double top; 2/ retest of up trend line


this one has shown a possible CIT (change in trend) from geometric point of view or daily MACD, and its internal structure appears to show a respect/harmony to the newly established down trend (clearer on hourly chart)
______________________________________
(updated on April 31st)
Sorry, a wrong wavecount, I think below is a better illustration showing the internal structure.

2016年3月4日 星期五
TA expert in a Singaporean forum
"Experts" and "professionals" are everywhere demanding tuition/subscription/gathering/sharing... FEES. In this world, many people are living on and also parasitizing on trading world. Anywayz...
Besides Hongkongers, there are TA practitioners/technicians in other places analysing HSI. One of them is BHills of forums.hardwarezone.sg (not advertising..,) who adopt TA to analyse HSI in ways that I agree with and quite similar to some of the skills I am applying.
 While most people in Hong Kong are still focusing on moving averages/basic geometric patterns, there have been many people in the world use other skills which look much proper and effective...
Besides Hongkongers, there are TA practitioners/technicians in other places analysing HSI. One of them is BHills of forums.hardwarezone.sg (not advertising..,) who adopt TA to analyse HSI in ways that I agree with and quite similar to some of the skills I am applying.

訂閱:
文章 (Atom)