2015年11月3日 星期二
hsi - A guess of coming pattern
the graph is showing, what I believe, a signal of a possible swing bottom:
1/ hold above 223xx; 2/ hold above internal line
Below is my guess of coming pattern:
2015年10月14日 星期三
883 td 20151014
low of today is 8.90 which is almost the .333 level of retracement between 9.60 & 7.41. If it is valid, it may reach a 100%-161.8% extension of the range of 9.60 & 7.41, that is 11.07/11.67/12.42. Personally, I think 11.67 is more likely than the others (see also http://koei1024.blogspot.hk/2015/10/883-monthly-weely-review.html).
2015年10月12日 星期一
USD/CNY 20151012
Although I am not a forex trader, I am continuously monitoring on some major or related exchange rates to me, e.g. EUR/USD, USD/IDR, USD/KRW. USD/CNY is one of them on my list.
The old swing bottom and top in year 2012 had significant effect on the movements until now, as shown in above chart.
2015年10月11日 星期日
883 monthly & weely review
883.hk/CNOOC was one of the stocks+indexes that I traded since 2007, the time I jumped into the market without adequate knowledge, and is still trading & monitoring. One of the reasons I am still trading it is that I earned for some times of sweat sums of money by trading its derivatives in 2008, and fewer occurrence than other stocks in having a loss upto this moment.
Obviously, this is undergoing a downward channel for years, and I was lucky enough in catching some tops & bottoms. And now, a critical moment has come - a potential bottom reaching the channel lower boundary, plus testing a nice retracement level, .786.
Its main trend is going down (downward channel) since there are lower-top-lower-bottomg according to its 3-bar monthly chart, many of the swing bottoms have already been broken. Although it is TOO far, there is a possible support at 3.83... (6 dollars lower from 9.27 or -64.7%...) obviously not a useful reference... 0.886 could be a higher support but still not much of practical use ...
By measuring each up & down moves, there are some noticeable tendency since 2011:
For down move, weeks taken are either 15-17 or 25-26; size is from 5.02-6.16 (10.20 excluded for a channel scenario)
For up move, weeks taken are either 19-22 (12 & 30 excluded); size is from 4.06-4.46 (7.08 excluded)
If the end of Oct. 2nd 2015 is a low and we try to project the coming up move from this point, I would expect a swing size of about 4 (I put 4.46 on the 2nd chart) and last for about 20 weeks. the projected price target is close to .618-.667 level between 13.70-7.41 which add to the meaningfulness of this projection.
Before that happen, a minor swing top at about 10.16 could be an important resistance, in order to identify change in a minor trend.
If the rebound is failed, it could land around 5.82-6.0 (.886 retracement level and a swing bottom) or even lower.
2015年10月9日 星期五
hsi resistance 20151009
fibo retracement levels 285-203:
23508 (.382)
24478 (.50)
25448 (.618)
26649 (.764)
1st target - 244-248 (or even 255)
2nd target (after a possible retracemtent, if a zig-zag ABC wave) - 265-270
2015年10月7日 星期三
有趣鞭策/鞭屍
現在會唔會有人突然又覺得恆指今年應該見3萬點以上呢, 等我鞭下屍先:
https://zh-hk.facebook.com/yeungwailung/posts/735807316461117
https://hk.finance.yahoo.com/news/%E6%B8%A3%E6%89%93%E6%A2%81%E6%8C%AF%E8%BC%9D%E6%96%99%E6%81%92%E6%8C%87%E8%A9%A6%E4%B8%89%E8%90%AC%E9%BB%9Eh%E8%82%A1%E4%BB%8D%E5%84%AA%E6%96%BCa%E8%82%A1-055400195--finance.html
http://www.on.cc/hk/bkn/cnt/finance/20150623/bkn-20150623144343512-0623_00842_001.html
http://www.dbc.hk/digitalmedia-detail/Id/56036/type/94/%E3%80%90%E6%B4%AA%E7%81%9D%E5%8D%9A%E5%AE%A2%E3%80%91%E6%81%86%E6%8C%87%E7%9B%AE%E6%A8%993%E8%90%AC2%20%E8%88%87%E3%80%8C%E4%B8%AD%E5%9C%8B%E5%A4%A7%E5%AA%BD%E3%80%8D%E9%A0%86%E5%8B%A2%E8%80%8C%E7%82%BA
http://www.etnet.com.hk/www/tc/news/categorized_news_detail.php?category=latest&newsid=ETN250623415
預測/估估下個個人都識 (opinions are like assholes, everyone has one...), 亦人人都會有錯, 我都成日自我鞭策 (=鞭屍), 事關 trading world 唔係睇一個人估得有幾準, 而係睇一個人估得準時做得啱唔啱 (let the profit run), 估錯O既時候又做得啱唔啱 (cut loss fast), in long run 做到賺比蝕為多, 所以量度O既時間係一世, 不爭朝夕.
2015年10月5日 星期一
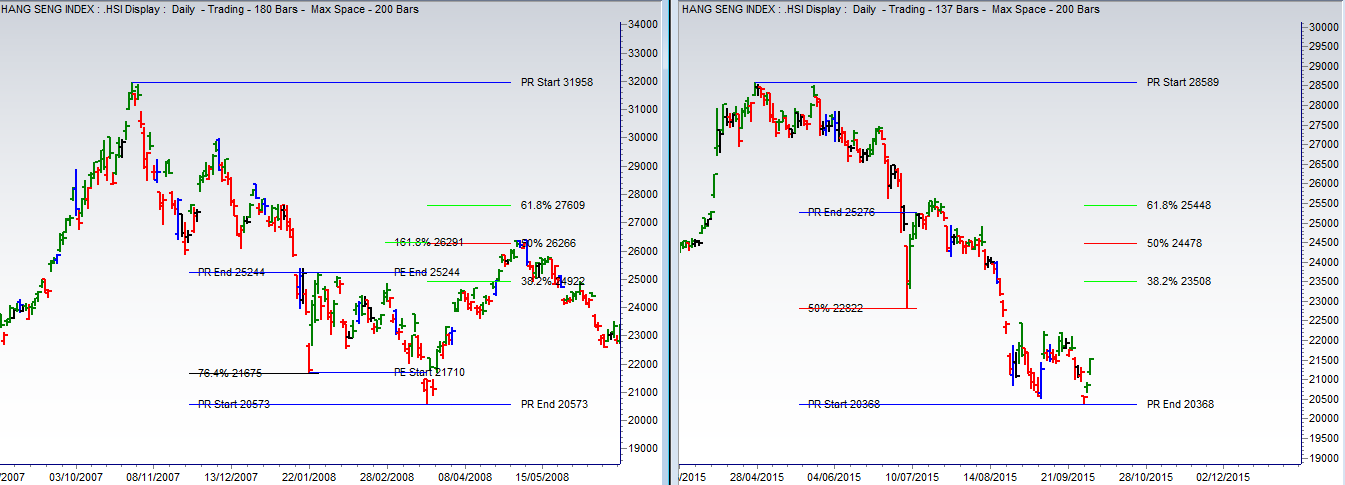
hsi 2015 vs 2007 vs 1997 - follow-up
http://koei1024.blogspot.hk/2015/08/hsi-2015-vs-2007-vs-1997.html
1997 scenario is no longer matching... 2007 still works...
2015年10月3日 星期六
dji short and long term views
Yesterday night before going to sleep, US market seemed to finish an ABC correction with its B wave 0.66 of C wave:
thereafter, a nice break-out followed
Macroscopically, US market looks like undergoing a series of similar expansion throughout last 2 decades:
monthly closing prices are pretty close to .618 (note this is a backward induction where its reciprocal is 1.618 a universal expansion rate). In general, it could be an expanding triangle or wedge that doom-day analysts may think there will be an End-of-the-world scenario (not End-of-Day... everything with a beginning has an end...) with a total market collapse to just a few thousand points (dji: 5847 if the same proportion is applied) ... Before that happens, looking at the fibo levels between 6470 && 18351 is more realistic at the moment, e.g. .382, .50, .618...
Looking at its 3-bar weekly swing charts, there are two swing bottoms (17038,15855) broken since the fall from end May 2015, but stopped above 15341. Therefore, a change in trend is confirmed.
Similar to hsi 's current situation, before the termination comes, I would expect a retracement to the north. 16933 is far too low to be the final point of this counter-wave.
From its 2-bar weekly swing chart, one of the possible targets could be 17466 which was a swing bottom in week of July 11th 2015.
From a geometric point of view, US market has also broken a weekly support trend line extrapolated from March 2009 and October 2011. Interestingly, when we apply a parallel trend line starting from the top in early Jan 2014, the market follows without violation.
If templates of Gartley pattern are applied, we could find some proportional relationships as shown in below charts:
If 15370 fits to .382, the market should follow with a retracement to the north and then try to find support at 14378 (0.50), 13440 (0.618) or 12280 (0.764) or even 1.000.
10404 is quite interesting since it is 102x102, a "square" number.
If 15370 fits to .50, the market should follow with a retracement to the north and then try to find support at 14718 (0.618) or 13859 (0.764) or even 1.000.
thereafter, a nice break-out followed
Looking at its 3-bar weekly swing charts, there are two swing bottoms (17038,15855) broken since the fall from end May 2015, but stopped above 15341. Therefore, a change in trend is confirmed.
Similar to hsi 's current situation, before the termination comes, I would expect a retracement to the north. 16933 is far too low to be the final point of this counter-wave.
If templates of Gartley pattern are applied, we could find some proportional relationships as shown in below charts:
If 15370 fits to .382, the market should follow with a retracement to the north and then try to find support at 14378 (0.50), 13440 (0.618) or 12280 (0.764) or even 1.000.
10404 is quite interesting since it is 102x102, a "square" number.
2015年9月30日 星期三
hsce td 20150929
comparing to hsi (a false break yesterday down to 203), hsce has a clearer picture.
There is a 3-bar daily swing top formed on Sep. 17th with high 10178.
After the formation of this double bottom has become valid (crossing 10178), there are some possible targets: .382, .50, .618, .764 where most of them are overlapping with the multiples of size of the swing (9059-10178) counting at top 10178.
Lastly, green and blue lines are support uptrend lines respected in the past, we will pay special attention if there will be possible re-test in Oct. or Nov.
2015年9月26日 星期六
2015年9月24日 星期四
Review of current situation - hsi 20150924
The amplitude of rebound upto this moment is very disappointing.
If Level of 224 was not broken, it could develop into a continuation pattern (range 205-224) resulting in a resume of down move; if 224 is broken, still could have a chance to surge to a higher level before the termination down move...
A. Trend classification:
weekly 3-bar
after previous swing bottoms 225 (Dec 2014), 211 (Mar 2014) have been broken, the uptrend started from 2011 is reversed. From the perspective of swing trading method, there is usually a retracement to a higher level to form a lower swing top before it resumes to fall which serves as a confirmation of downtrend.
A signal bottom is observed in the week of Sep. 12th 2015 for a down swing lasted for 19 weeks which provides a marker of a possible counter-trend movement. Only aggressive traders with sound money management are capable to take advantage of this counter move since the move is vigorous and rather short-term. Upto this moment, the market is still trading within the weekly range of this signal bar, we should pay attention to its break-out and follow with good money management.
Trade with the main trend is important for a swing trader.
There is a possible symmetry in time that from week Dec 12th 2014 to week May 2nd 2015 is also 19 weeks compare to that from May 2nd 2015 to Sep 12th. 2015. Besides, mid point of May 2nd to Sep 12th is roughly the week of Jul. 11th 2015 which provides a proportion relationship within this down move.
The slope from high of May 2nd to low of Jul. 11th (thick blue line) is less steep than the one from high of Jul. 25th to low of Sep. 12th. (thick red line)
weekly 2-bar
considering the move from May to Sep 2015, those support levels are similar to the 3-week swing chart. no intermediate swings top/bottom is formed during the period. No hints for any possible turning point is presented.
daily 3-bar
the current trend is a downtrend given a lower-top-lower-bottom scenario. Another signal bottom can also be located in this time-frame on Sep. 8th 2015 (same week in Sep. 12th) which is an outside bar followed by a gap up. This downtrend can only be reversed when it crosses 256 (too high for the moment) or a 3-bar swing top formed in coming future.
From April 27th 2015 to Sep. 8th 2015, it took 92 trading days and the outside/signal bottom was formed. We should pay special attention to this signal bottom after this prolonged down move for a possible change in trend.
daily 2-bar
B. Strategy: (updated on Sep. 25th 2015)
scenario b1. reversal - counter a downtrend
there must be some markers/indicators for an entry: MACD cross,
trendline broken, cross of 225 etc. some analysts think there is a
head-and-shoulders bottom in formation,target 50% of 285-205 re-test
is 245 (matches with a of weekly trendline 2009March & 2012 June
bottoms), more aggressive 255-267 in a zig zag ABC counter swing/wave
scenario b2. continuation pattern scenario
daily 2-bar swing chart - intermediate consolidation would be over after
205 level was crossed, sets cut loss at entry point 2% above the previous
high and trailing stop
scenario b3. side-way for months
can just wait la...
C. Other markers:
1/ MACD - (weekly) no bullish cross, no divergence; (daily) may be a bearish cross
coming
2/ RSI - (weekly) near 30 level but no obvious divergence; (daily) a divergence
between the double bottom (Aug. 25th & Sep. 8th 2015)
3/ Volume - (monthly & weekly) the volume is shrinking from May to Sep. 2015,
volume of bottom in Sep. 12th 2015 is lower than that of Jul. 11th
2015, a possible divergence
4/ Geometry - (weekly chart) market has broken a long-term support trend line back
into 2008-09. It has been respected for many years, and we should be
aware of a possible re-test of the same trend line. However, since the
uptrend has been reversed, I would expect a different (set of) down
trend line would establish & be respected. In fact, expansion and
contraction speeds are different.
If Level of 224 was not broken, it could develop into a continuation pattern (range 205-224) resulting in a resume of down move; if 224 is broken, still could have a chance to surge to a higher level before the termination down move...
A. Trend classification:
weekly 3-bar
after previous swing bottoms 225 (Dec 2014), 211 (Mar 2014) have been broken, the uptrend started from 2011 is reversed. From the perspective of swing trading method, there is usually a retracement to a higher level to form a lower swing top before it resumes to fall which serves as a confirmation of downtrend.
A signal bottom is observed in the week of Sep. 12th 2015 for a down swing lasted for 19 weeks which provides a marker of a possible counter-trend movement. Only aggressive traders with sound money management are capable to take advantage of this counter move since the move is vigorous and rather short-term. Upto this moment, the market is still trading within the weekly range of this signal bar, we should pay attention to its break-out and follow with good money management.
Trade with the main trend is important for a swing trader.
There is a possible symmetry in time that from week Dec 12th 2014 to week May 2nd 2015 is also 19 weeks compare to that from May 2nd 2015 to Sep 12th. 2015. Besides, mid point of May 2nd to Sep 12th is roughly the week of Jul. 11th 2015 which provides a proportion relationship within this down move.
The slope from high of May 2nd to low of Jul. 11th (thick blue line) is less steep than the one from high of Jul. 25th to low of Sep. 12th. (thick red line)
weekly 2-bar
considering the move from May to Sep 2015, those support levels are similar to the 3-week swing chart. no intermediate swings top/bottom is formed during the period. No hints for any possible turning point is presented.
daily 3-bar
the current trend is a downtrend given a lower-top-lower-bottom scenario. Another signal bottom can also be located in this time-frame on Sep. 8th 2015 (same week in Sep. 12th) which is an outside bar followed by a gap up. This downtrend can only be reversed when it crosses 256 (too high for the moment) or a 3-bar swing top formed in coming future.
From April 27th 2015 to Sep. 8th 2015, it took 92 trading days and the outside/signal bottom was formed. We should pay special attention to this signal bottom after this prolonged down move for a possible change in trend.
daily 2-bar
when we switch to a 2-bar daily swing chart, we can observe that there is a pair of intermediate swings top & bottom formed after Aug. 25th 2015 and the market is, in fact, trapped in a range between 205 & 224. We should wait for a break-out to signal either a reversal or a continuation of a downtrend.
A recent swing top at 22424 is near an old swing bottom 22530 in Dec. 2014. as a resistance.
scenario b1. reversal - counter a downtrend
there must be some markers/indicators for an entry: MACD cross,
trendline broken, cross of 225 etc. some analysts think there is a
head-and-shoulders bottom in formation,target 50% of 285-205 re-test
is 245 (matches with a of weekly trendline 2009March & 2012 June
bottoms), more aggressive 255-267 in a zig zag ABC counter swing/wave
scenario b2. continuation pattern scenario
daily 2-bar swing chart - intermediate consolidation would be over after
205 level was crossed, sets cut loss at entry point 2% above the previous
high and trailing stop
scenario b3. side-way for months
can just wait la...
C. Other markers:
1/ MACD - (weekly) no bullish cross, no divergence; (daily) may be a bearish cross
coming
2/ RSI - (weekly) near 30 level but no obvious divergence; (daily) a divergence
between the double bottom (Aug. 25th & Sep. 8th 2015)
3/ Volume - (monthly & weekly) the volume is shrinking from May to Sep. 2015,
volume of bottom in Sep. 12th 2015 is lower than that of Jul. 11th
2015, a possible divergence
4/ Geometry - (weekly chart) market has broken a long-term support trend line back
into 2008-09. It has been respected for many years, and we should be
aware of a possible re-test of the same trend line. However, since the
uptrend has been reversed, I would expect a different (set of) down
trend line would establish & be respected. In fact, expansion and
contraction speeds are different.
2015年9月22日 星期二
hsi hourly 20150922
most likely, it will be an ascending triangle, but better to wait for a valid break above resistance line at the top.
http://www.investopedia.com/university/charts/charts5.asp
2015年9月13日 星期日
2015年9月12日 星期六
2015年9月9日 星期三
hsi 20150909
http://koei1024.blogspot.hk/2015/09/hsi-double-bottom-20150907.html
A good "double" signal: signal bottom (bar pattern: weekly+daily) + double bottom (classical pattern).
Today is Sep. 9th : 9th day of 9th month. that's double positive and may mark the end (123456789) of this decline, at least for this turn.
On the other hand, Germany has a break away gap up, after a triangle has formed:
2015年9月7日 星期一
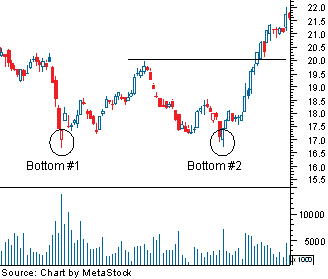
hsi double bottom 20150907
let's hope for a decent rebound!
Volume of the later bottom is usually lower than the former one.
http://i.investopedia.com/inv/articles/site/Doublebottom.gif
Volume of the later bottom is usually lower than the former one.
http://i.investopedia.com/inv/articles/site/Doublebottom.gif
2015年8月28日 星期五
A way to determine a CIT by Mr. James Hyerczyk
this is an extracted graph from Mr. James A Hyerczyk's book about swing trading method, which shows one of the ways in determining a change in trend.
For me, the move from 285-228 was obvious that there would be a possible CIT. However, in the perspective of swing trading, it hasn't confirmed a CIT yet. When the market reached as low as 208, it fits into the pattern defined and we should expect a retracement to a higher level before the market resume its main trend down. My guess of pattern on July 8th based on wave theory is compliant to this swing set-up, too.
http://koei1024.blogspot.hk/2015/07/hsi-possible-support-20150708.html
For me, the move from 285-228 was obvious that there would be a possible CIT. However, in the perspective of swing trading, it hasn't confirmed a CIT yet. When the market reached as low as 208, it fits into the pattern defined and we should expect a retracement to a higher level before the market resume its main trend down. My guess of pattern on July 8th based on wave theory is compliant to this swing set-up, too.http://koei1024.blogspot.hk/2015/07/hsi-possible-support-20150708.html
2015年8月23日 星期日
Expecting an end of wave B
I am not surprised with some wrong expectations or entries since these are part of the trading game. What really surprises to me is the target & pattern I guessed on July 8th... Sometimes instinct is more accurate than logical thinking... Moreover, I still insist a corrective wave undergoing based on my assumption.
After the two scenarios of a retracement between 228-256 and a double bottom have been rejected, now the only possible one left is an expanded flat wave with wave B at an extension of wave A (228-256).
Actually, there are two possible targets for this turn, since they are really close (just about 1% apart), I personally prefer 216 than 213 due to a higher chance of occurrence of .764 from my observation.
2015年8月22日 星期六
A possible confluence level for US
conditionally, this confluence level should provide a certain of support.
If it holds, I would expect a trading opportunity using Gartley pattern provided that 184-164 is AB move.
2015年8月19日 星期三
2015年8月16日 星期日
hsi 2015 vs 2007 vs 1997

people always say: history repeats itself... but HOW?
some believes in Elliot wave theory that any market can be classified into impulse waves and corrective waves which make a market look alike in many different time-frame (that's self-similarity behaviour of fractals) It's like how leaves, branches are grown on trees.
One's belief system influences his/her behaviour. Thus, building up a "reliable" and "beneficial" system is crucial to anyone who wants to participate in this survival game.
In trading world, there are too many aspects/skills/methodology of technical analysis to name. A very important objective is we are here to earn a living as a basic requirement, and for those who are more skillful/gifted, they can even earn a fortune by trading (or investing). For me, investing is just part of the game of trading, that we bet on probability a public list company/index future/currency could move in favour of us, no matter it is by analysing financial report, GDP forecast, import&export data, or OHLC price data at a longer time-frame.
Above chart is a comparison of the wave forms of hsi in different periods. A point in common is that there is a sharp fall followed by a side-way development. Certainly, this is only for educational purpose, not a trading advice.
In the mini-chart on the left, since the correction wave was an expanded flat where B exceeded the start of A and C exceeded the start B. This was my initial assumption when the market reach 228-239 level.
My guess now is there will be a top near 266 regardless of which type of the corrective wave will form
"Nothing just happens, everything is planned" in the view of the trading index/stock/commodity, there are usually something left for us to trace.
2015年8月10日 星期一
A guess of coming pattern (revised Aug. 10, 15)
http://koei1024.blogspot.hk/2015/07/a-guess-of-coming-pattern-rev-jul-20.html
![]() |
| with the given time frame (early/mid Aug.), market has completed a 50% retracement. a situation of bullish but rather side-way could happen until mid/end Sep. |
訂閱:
文章 (Atom)