2014年10月17日 星期五

1928 20141017

1/ (hourly) flag formation at current level, can regard this as breaking to upside now and possible to continue for some days/weeks;

2/ (daily) broke the swing top@43.75 on Oct. 7th;

3/ (daily) today's volume is almost (or even higher at today's closed) that of Oct. 7th, could also be possible for a valid CIT;

4/ most importantly, Oct. 16th is one of the most important turning points within 2014.

2014年10月9日 星期四

Gold/2840.hk 3rd time at same level


- temporarily broke 892 but close at higher level, a nice false break
- intermediate turning point quite close to 0.667 or 2/3, projection in terms of time still works
- counter-trend bounce is expected until mid Dec., may touch green line again or around 950

http://koei1024.blogspot.hk/2014/09/2840-gold-etf-update-20140923.html

2014年10月5日 星期日

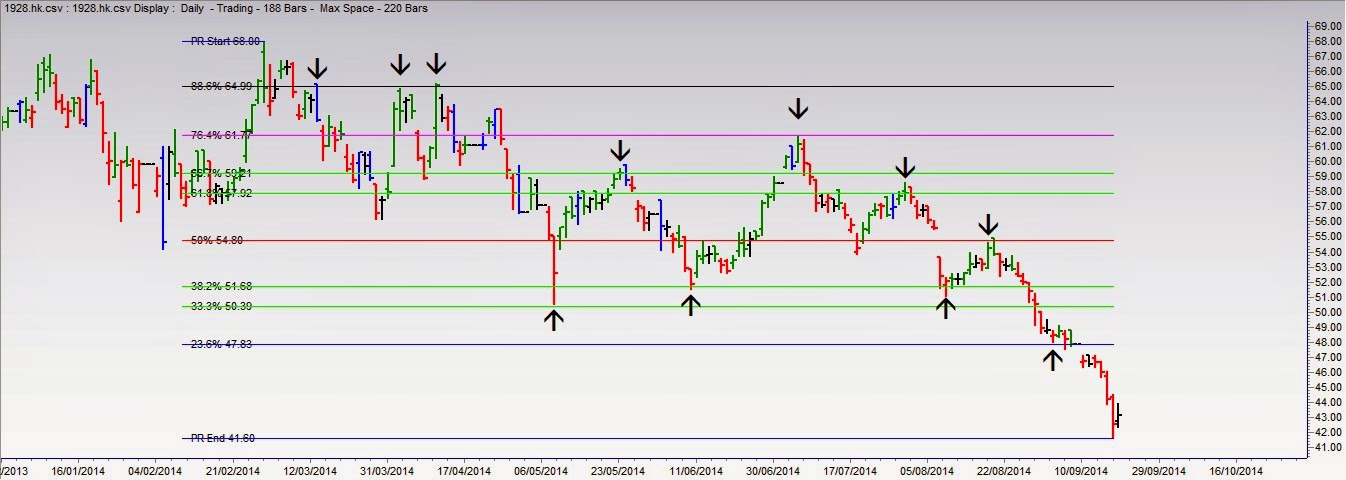
study of 1928's gartley pattern and ratios

 Gartley pattern under Larry Pesavento's latest version:
XA-AB-BC-CD and their inter-relationship
I assume X starts at 20.65 (not 33.50 this time) and A at 68.00
 end of CD is nicely on 0.618 retracement level, end of AB is almost perfect, just about 60 cents away.
 C is obviously ended at 0.618 retracement of AB
CD is about 1.33 (not 1.382) of AB starting from point C

2014年10月3日 星期五

US index 20141003

assume a fibo extension here:
the index has undergone an expanded (flat correction wave) A-B-C, ratio here is quite rare which is 3.14*A=C
it is far before the end, if one says it is just a retracement from previous range, the index stopped on 2/3.

2014年9月23日 星期二

2840 (gold etf) update 20140923

projected downtrend does not work perfectly, so I added another recent downtrend starting from Mar. 2014

Time projection to May 2015 for final bottom this intermediate term


http://blogcity.me/blog/reply_blog_edit.asp?f=Y5FN0M3HNS239764&id=623097

2014年9月19日 星期五

1928 finished wave A

diamond top, retest at 61.65, retraced to .764 level of previous range


A = 1.3333 x A (c) or
0.75 A = A (c)

2.236 x A (c) a' = A (c) c'


Below is a very nice picture of how stock respect fibo at different levels. closes around these levels also count. Plus one weekly signal bottom bar pattern after a decline lasted for months, so...


(in addition to whether .764 vs .786 or .618 vs .666 or .382 vs .333, one can assume either of them in advance if we know nothing of the subject under study. After viewing into the past data, one should know the tendency of which to use or similar/uncertain chance in occurrence)

2014年9月12日 星期五

883 & 939 wk 20140911

 reaction to .886 & downtrend line

(level of top adjusted)
reaction to downtrend line

2014年9月11日 星期四

2014年8月21日 星期四

2014年8月1日 星期五

2014年7月23日 星期三

new break-out? or near the end?

July 16-17 was not a reversal point, so we need to wait for a more valid, counter-confirm by other methods

http://thepatternsite.com/EWDiagTriangle.html

current situation obviously not a 5 impulse wave condition as latter corrective wave overlapped previous impulse wave.
Therefore, we better try to understand it as a corrective wave condition. the lower and upper trendlines are converging and it is possible for a temporary throw-over as Mr. Bulkowski suggested.
What we need to wait is whether the market falls back to the area within the red triangle and initiate an reversal.

Indicators like MACD is shrinking which could lead to a break-out or sideway situation.
Volume is also shrinking with higher top, which could be a dangerous signal to bullish view. meaning buying power to support higher top is weakening.


there are 2 possible target of the c3 of C wave: 23947-23979, and 24152-24153
These are the extension from the a wave of c3 and A respectively.
I also added an old top 24111 in Dec. 2013 as a reference point.

2014年7月20日 星期日

1928 possible gartley pattern

 it was under monitor of its possible formation of a kind of gartley pattern, now the development has proven it is valid pattern formation

reference for gartley pattern, in fact mine is not perfect one according to strict rules like this... anywayz, the proportion mostly fits

sp500 target

although it is not my market for trading, reference to it sometimes is useful especially during the time or big reversal could happen... the later range is about 1.618 of the former range in same direction... what can be more conclusive than this?

2014年7月17日 星期四

hsi td 20140717

唔遲唔早, 時間o岩o岩好就出招 (outside bar?)
Bradley big day was July 16, 2014...

2014年6月27日 星期五

2014年6月25日 星期三

尋底? bottoming?

本年4月向友人提出以16.5或SAR(DAILY)為止蝕, 當時股價剛升到18.X的最高位, 我提出8050走勢會似BITCOIN, 不斷向下尋底. 可喜友人只蝕數千, 不致慘敗, 因友人早前聽信消息此股可爆升至22元以上, 不過我一直持保留意見. 若持貨至今, 可蝕數以萬計.

883, 939 20140625


 a recent high reached 0.618, good gain-loss ratio for entry, target 13.1->12.5
Remarks: range for fibo. needs not to be the previous whole swing, more important is different level of fibo. are respected by its internal structure, e.g. top or bottom rest on fibo ratio., it respected once, it will respect one more; twice, two more, etc.


________________________________________________________________________


 939 nearly touches the downtrend of weekly closing prices, its internal structure quite respects fibo.
very bearish should see a double bottom around 4.7-4.9, at the moment just for around 5.25-5.27


a closer look of fibo being respected.
(I hid the green diagonal on purpose...)


2014年6月19日 星期四

883 td 20140619

today, we could be seeing a top (today's high now is 14.26)
I wrongly guess it will reach bottom before reaching this high level... anyway
(upper trend line amened)

2014年6月10日 星期二

1928.hk 20140610 diamond pattern

nothing is as obvious as this one,
bar sequence: 1st bar, outside, outside, inside, inside... crazy!
everyone trading during the period were trapped...


more than that, it broke downward...

2014年6月8日 星期日

939 td channel 20140606


expecting a mild pull-back... this stock is more easily or perfectly fit into fibo than 883, maybe just my mis-understanding


883 20140606

expecting a  short-term pull-back ... either of the time
 longer term, expecting a quick surge after the above mentioned pull-back, weekly should close around, or perfectly below, an important weekly bot overlapping a fibo@.764
a clearer pic. showing the trendline forming a resistance for weekly closing prices... of course, sometimes it jumped higher than the line for a short while...

2014年6月6日 星期五

700 vs hsi 2003-2009


end of trend? start of trend?


both trend of 700 & 1928 look familiar, quite similar to hsi in 2003-2007 period.

using semi-log chart could provide a better "picture"...

(Updated on June 8th)
this kind of topping pattern is commonly called 'diamond top pattern', pls refer to investopedia for more detailed explanation

2014年5月31日 星期六