2015年6月25日 星期四

883 td 20150625

hopefully, it is developing into side-way condition ...

in extreme case, (main trend down in red box) there may be a moderate correction before the last leg has gone down...provided 10-20% is ''moderate'' enough here...


http://koei1024.blogspot.hk/2015/05/883-td-20150520.html

2015年6月22日 星期一

Gannalyst... is gone

Gannalyst, although it is the second charting software I tried (first is the aptistock, no longer in use), it is the one I have been using ...  for over 6 years. It needs some extra work to feed in the data source but it is worth the effort...

Geometry, Fibonacci, angle/speed/trend lines, time count, division/projection of time and price, logarithm, etc. many things I learnt through using this software

hope it will be back soon!

2015年6月16日 星期二

2015年6月10日 星期三

hsi 20150610

 isn't it a double top? 2nd weaker than the 1st in terms of volume
 isn't it a typical distribution topping pattern?

hsce 5-min expanded triangle

this is a short-term view, but it is clear that it is moving sideway.

Whether it will be confirmed as a continuation expanded triangle or a bottoming pattern, it is better to wait until its break-thru and act...

2015年6月8日 星期一

2015年6月4日 星期四

DAX - a market leader?

After a valid retracement,  should not be very hard to anticipate the near-term trend?

2015年5月20日 星期三

my way to look

 
my way to look at this, need to re-adjust the "x-axis" horizontal line by myself...

883 td 20150520

expect for just a retracement? or to find a hellboy in the deep valley?

2015年5月16日 星期六

market is full of opportunities

market is full of opportunity, set your mind free... free from media which is sometimes giving wrong signal to attract outsiders/less mature investors leading to catastrophic results... you know, this is a cruel surivial game that those superior players (insiders/mature/experienced/skillful), of just a few percent of the crowd, take away the money earned hard by the inferior

concentrate on market movements, great opportunities are everywhere waiting for those who can follow its trend. I take a few examples from HSI only by a glance, tactics is 'buying when previous swing top is broken'. 


hsi market symmetry 20150515

a very nice 'time' symmetry! what will be the next?

2015年5月4日 星期一

2015年4月15日 星期三

823 wk 20150415

 first target: 1 to 1, about 0.764-0.786 retracement, max. 100%

700 wk 20150415

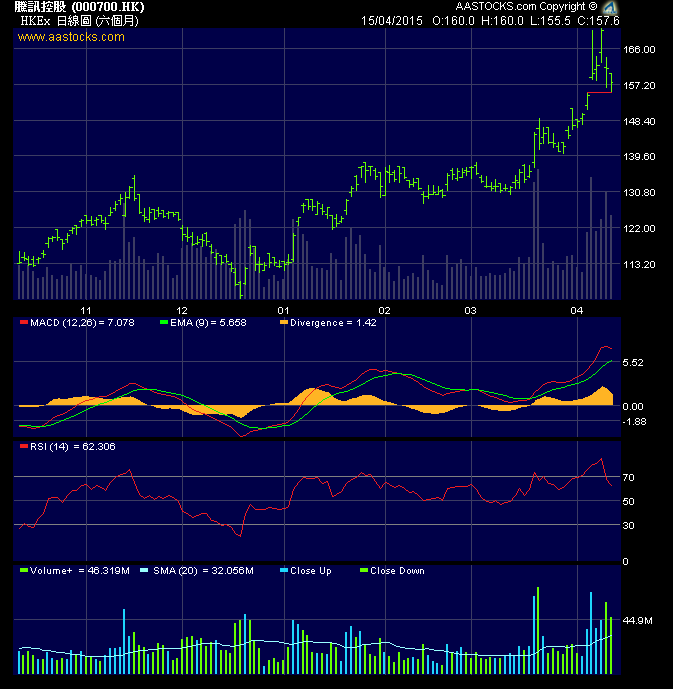
key reversal pattern... not a good time to consider now...


assumed this is an exhaustion gap, which is filled today, so a retracement to around 166 is possible before a main reversal takes place...

2015年3月27日 星期五

2015年3月26日 星期四

hsce td 20150326

a guess only (previous guess on hsi was removed due to some mistake in calculating the time)

2015年3月19日 星期四

hsi td 20150318


in order to understand the development, calculating the ratio of price and/or time is useful.

be patient a top with very high volume, for example 130-150 billions HKD

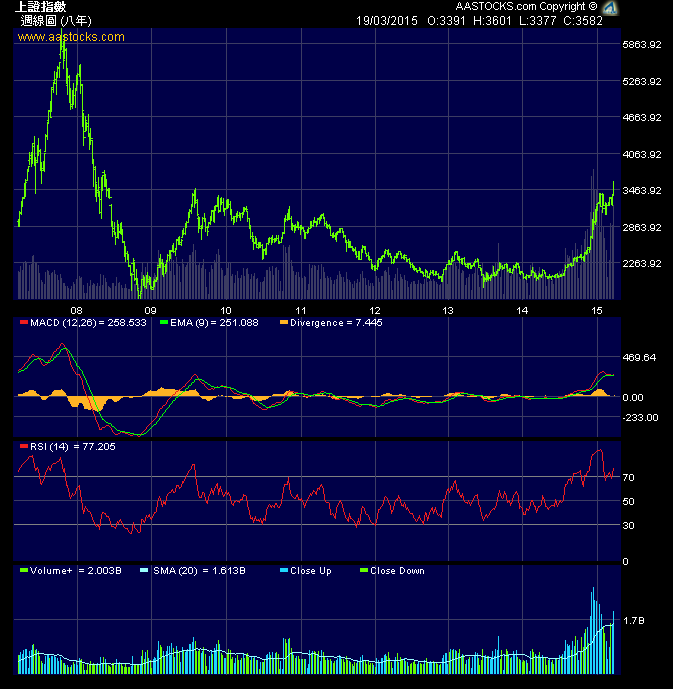
sse vs dji 1931-1950 -follow up


obviously, this turn is near the end


(repost below)

2015年2月11日 星期三

SSE hr 20150211

MACD divergence. If it follows with a break of downtrend, one should expect room into the north...


2015年2月6日 星期五

2015年2月3日 星期二

plan for the worst, hope for the best


crazy people matching with crazy market, that's why history repeats itself but in its own way and dimension.

the index on the right dropped 66% from the top, it would make many people outrageous if it happens somewhere else...


2014年12月15日 星期一

2014年12月10日 星期三

883 bottom projection 20141210

 since the channel/bottom trendline is broken, I think there are more room to go south with 2 of the possible projection of target bottom price as shown on pic.
Price below 10 will be VERY attractive if we look back 1-2 years later

1928 td 20141210


previous assumption was violated when bottom line of asymmetrical triangle was broken.
as the price sinks, a strong buying signal/pattern is in development - double bottom.

Time, this rebound could last until end Dec. or early Jan.
Price, probably 53-54

2840 wk 20141209

 today, even the (green) down trend line is broken. Time fits the change in trend as well (a little adjustment to "end point")
retracement at 78.6

sse vs dji 1931-1950

a pair of top & bottom will follow. After that, it could be very long time for bull