2015年11月30日 星期一
hsi possible triangle
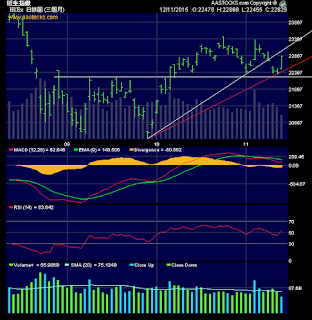
upper chart (OHLC): red lines form a triangle using unconventional trendlines; white lines are more conventional
lower chart (closing price chart): a closing price in mid Sept. were respected twice in November, its importance should be under-estimated ...
2015年11月20日 星期五
hsi 20151120 @ market close
http://koei1024.blogspot.hk/2015/11/hsi-td-20151119.html
when the ending bell rings, the market:
1) though not achieved, if next week is also a up bar, 219 could be a swing bottom
2) applying from the observation seems work, wait for Nov. 25th to see if any possible turning signal
3) it has broken the trendlines, look for more rooms in the north if it is a valid break-out
883 - possible long term bottom coming
After 883 has failed to climb higher, I hold a different view of it from hsi and my bearish target is about 5.3-5.5 in 2016 Q1/Q2
2015年11月19日 星期四
hsi td 20151119
My idea now:
1) swing trading perspective:
weekly, to avoid a 3 conservative down bar, it is better to have an outside bar this week to signal a possible change in direction. So, today and Friday are important to watch for whether the market can seek more rooms in the north exceeding 22981. Otherwise, watch for more downward pressure if weekly closes below 22396 or 22319.
2) bar pattern:
Since end Sep. 15, we have 5 island bottom bars and every of them is followed with a gap-up. there were 3 times that market found a top in 2 days after the island bottom; one time found a top in 7 days. Compare to the current move, it is now 3 days from the isolated bot. Could we expect that it be similar to the one in end Sep.?
3) geometry(trendline):
with breaking the trendline, it could signal a possible change in direction, otherwise, continue with down move
2015年11月14日 星期六
A change to short-term bullish view
next week if hsi weekly bar is a down bar, I would change to become bearish since Oct 26th could be a significant turning date. When time squares price (td closing price below 0.333 and time 0.333 between top&bot), many people would think it is valid now.
I would set myself a stop order at 220 for hsi since a re-test is more likely; similarly, 883 will find its ground to land instead of 11.66... Certainly, if that happens, this could be an once-in-a-life opportunity to buy like a big sale.
http://koei1024.blogspot.hk/2015/11/hsi-20151112.html
http://koei1024.blogspot.hk/2015/11/883-td-20151104.html
The down move from Oct. 26th would end around early Jan. reaching a level as low as 205-208, which would follow with a rebound for just a few weeks into March 2016 and then a termination fall. Some people think 15k in Q2 or Q3 of 2016 but who can actually know...
DJI has reached .886 or 18000 level and react/fall decisively, this retracement has ended...
http://koei1024.blogspot.hk/2015/11/dji-short-and-long-term-views-follow-up.html
2015年11月12日 星期四
hsi 20151112
hourly: short-term reversal
2 scenarios:
A: correction with support from previous swing top in Sep., white horizontal line
B: re-test of white trendline
Which is correct? let the time tells... personally, I prefer A
Since from weekly chart, it is still within the range of previous weekly bar... just wait for a break-up of the range between 223-234
2015年11月4日 星期三
883 td 20151104
.333 - .382 level is not supportive this time, it eventually reached a level near .500 twice (short term double bot) on daily chart and follows with today's break-away & wide range bar. I would expect an extension (>1.00) of this CD move, target 11.66
2015年11月3日 星期二
dji short and long term views - follow-up
http://koei1024.blogspot.hk/2015/10/dji-short-and-long-term-views.html
Swing bottoms 17038, 17466 were broken after the previous post; fibo .764 isn't provide much resistance at all. Now it could be 18000 or .886 to provide a certain resistance.
My guess is, the market strength could even bring us to 18351 or slightly higher (1.618 extension shown on monthly chart).
Swing bottoms 17038, 17466 were broken after the previous post; fibo .764 isn't provide much resistance at all. Now it could be 18000 or .886 to provide a certain resistance.
My guess is, the market strength could even bring us to 18351 or slightly higher (1.618 extension shown on monthly chart).
hsi - A guess of coming pattern
the graph is showing, what I believe, a signal of a possible swing bottom:
1/ hold above 223xx; 2/ hold above internal line
Below is my guess of coming pattern:
訂閱:
意見 (Atom)


